


NAAIM Speaks is monthly newsletter containing market insights and analysis from NAAIM member firms. “Speaks” is designed to provide a plethora of market analysis, indicators, some occasional humor, as well as a summary of NAAIM’s proprietary Dynamic Asset Allocation Model and Managers Exposure Index. The report is for informational uses only and is not to be construed as investment advice.
WOW!
By: Paul Schatz, Heritage Capital LLC
Published: 6.5.20
![]()
That was not supposed to be the headline for this morning. After yesterday I figured the employment numbers would be grim, but stocks would rally again because let’s face it; stocks have rallied on all bad news and pretty much all news. When the May employment report was released at 8:30am this morning, I thought it was a typo. I am sitting there watching it with an incredulous look on my face saying that it had to be wrong. How could the economy ADD 2.5 MILLION jobs when economists were expecting a loss of 7.5 million jobs. That’s a 10 million delta!
Yes, I know. Economists are no better than weather forecasters. But how could they miss by such an unthinkable margin?….
Turning The Corner
By: David Moenning, Heritage Capital Research
Published: 6.1.20

It appears the general theme of the market these days is we have turned the corner in terms of the virus and the self-inflicted damage done to the economy. This is clearly good news. And to be sure, a collective sigh of relief is warranted. But…
Are We There Yet?
By: Jeffrey Miller Dash of Insight
Published: 6.1.20

There is widespread willingness to look beyond the chasm of this recession and ask what it will be like on the other side. You can almost hear the chorus of voices asking, “Are we there yet?” Or might there still be a few detours on the road to Wally World?
The Message From the NAAIM Indicator Wall: The Trend is Your Friend
By: National Association of Active Investment Managers
Updated: 3.2.20
The NAAIM Indicator Wall provides a weekly update to a robust array of stock market indicators. The “wall” includes readings and explanations of indicators and/or models in the areas of price/trend, momentum, key price levels, overbought/sold readings, sentiment, monetary, economic, inflation, and market cycles.
This time, we’re featuring the Price Trend Board, which is designed to tell us about the overall technical health of the current trend.
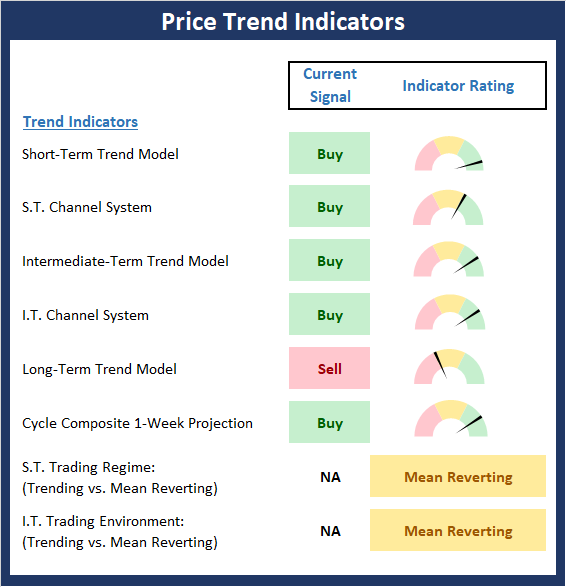
Note: The Indicator Wall is a benefit provided to NAAIM Members and is password protected. To obtain a temporary password, contact NAAIM at 888-261-0787.
About That Inverted Yield Curve
By: Ryan C. Redfern ShadowRidge Asset Management
Published: 5.30.20

Does anyone recall the inverted yield curve of mid-last year and its projection that we’d enter recession sometime in mid-2020? While we would never have expected the Coronavirus to be the trigger, it looks like we could be getting a recession right on time.
Since the broad markets hit their recent low on March 23rd, we’ve seen good, continuous strength with little signs of a re-test of the lows. Last month we said, “everyone seems to be expecting the market to re-test the lows we saw in March,” but that got us thinking, if everyone is expecting it, that might not be what’s coming soon. …
Focusing On Credit Risk
By: Rob Bernstein, RGB Capital Group
Published: 6.1.20
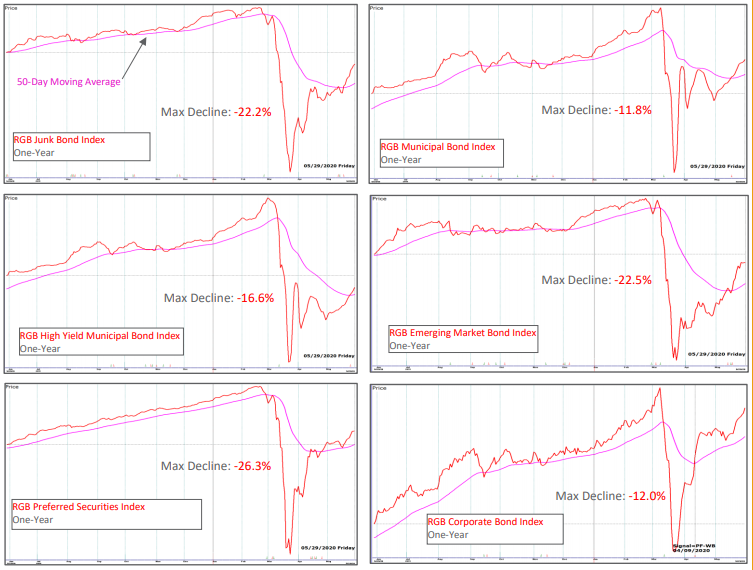
The charts above represent six indices that I maintain to track some of the bond / income segments of the market. Each
index is derived from an equally-weighted composite of mutual funds representing the category (you cannot invest directly in these indices). These groups tend to trend on low volatility but are also subject to steep declines when market risk is elevated. As an example, these groups declined significantly during the recent market selloff as noted by the peak to trough declines (labeled Max Decline above) that started in late February and continued through late March. While these types of declines can be devastating to our ability to grow wealth, we can use moving average timing techniques (that is, own the asset when they are above a predetermined moving average and sell when they drop below their moving average) to minimize the decline when these types of events happen.
The NAAIM Dynamic Allocation Model
Designed to be a value-add benefit to membership, NAAIM offers a Dynamic Asset Allocation Model based on the NAAIM Indicator Wall of indicators and models. The overall objective of the model portfolio is to dynamically adapt to changing market environments and to keep equity exposure in line with conditions. The model targets a normalized allocation of 60% stocks and 40% Bonds.
Here is this week’s model allocation:
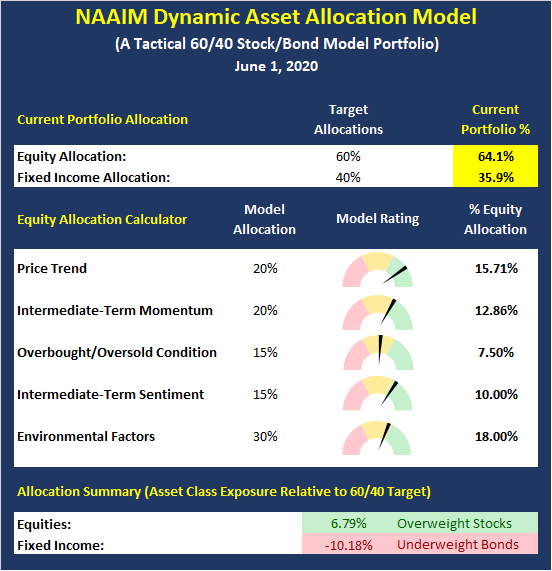
The model has been run live on the NAAIM website for several years and has demonstrated the ability to reduce exposure to market risk during negative environments such as those seen in 2015-16 and 2018.
More on the Dynamic Allocation Model and Historical Readings
The NAAIM Dynamic Allocation Model is for illustrative and informational purposes only, and does not in any way represent an endorsement by NAAIM or an investment recommendation.
“Missed It By That Much!”
By: Sam and Bo Bills Bills Asset Management
Published: 6.5.20

Well the experts certainly got that number wrong! Economists and Wall Street gurus alike were predicting another mammoth job decline in the report that hit the tape this morning. Instead of the expected 8 million job losses, the economy posted a gain in new jobs of 2.5 million. For those old enough to remember Get Smart, they “missed it by just this much!” …
The Technicals Are Telling Us…
By: Craig Thompson, President Asset Solutions
Published: 6.1.20
Market technicals have improved substantially over the past month. The S&P 500 has advanced above a major area of resistance and it’s 200-day moving average. This combined with much-improved market technicals suggests that market risk has subsided and the odds of higher stock prices in the near-term have increased.
Fear Trumps Danger
By: Dexter P. Lyons Issachar Fund
Published: 5.31.20

It is critical to be able to distinguish between fear and danger. Fear is the emotional risk that we perceive, and it is often blind to the facts. For example, the chances of dying from a shark attack are small, but the thought may cross one’s mind while swimming in the ocean. Danger is measurable, and in the case of sharks, the danger is low, even if the fear is sometimes high. Many people have made decisions based on the fear of COVID-19 and not the actual data. According to the CDC, 81% of deaths in the US are people over 65, most with preexisting conditions. For those below age 55, the death rate is currently around 0.0022% or one in 45,000 people. Below 25 years of age and the death rate of COVID-19 is currently around 0.00008% or roughly one death in 1.25 million people. Yet, we have …
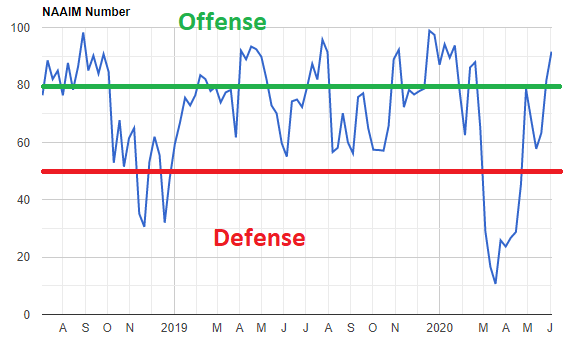
The NAAIM Member Exposure Index: Managers Are Onboard
The NAAIM Exposure Index represents the average exposure to US Equity markets as reported by our members in the organization’s weekly survey. Note that many NAAIM members are risk managers and tend to reduce exposure to the markets during high risk environments.
The last week’s exposure reading was 91.6, which remains a Positive reading.
More on the NAAIM Exposure Index
NOT INVESTMENT ADVICE. The analysis and information in this report and on our website is for informational purposes only. No part of the material presented in this report or on our websites is intended as an investment recommendation or investment advice. Neither the information nor any opinion expressed nor any Portfolio constitutes a solicitation to purchase or sell securities or any investment program. The opinions and forecasts expressed are those of the editors and may not actually come to pass. The opinions and viewpoints regarding the future of the markets should not be construed as recommendations of any specific security nor specific investment advice. Investors should always consult an investment professional before making any investment.
Tags: NAAIM, NAAIM Speaks, Stocks market analysis, Stock Market Analysis, Stock market, stock market indicators, David Moenning, Paul Schatz, Jeffrey Miller, Rob Bernstein, Ryan Redfern, Sam Bills, Bo Bills, Dexter Lyons, Craig Thompson, Len Fox, NAAIM Exposure Index, NAAIM Dynamic Allocation Model


