


Thirteen Charts Tell The Story
By: David Moenning, Heritage Capital Research
Published: 3.5.19

It is said that a picture is worth a thousand words. So, this week, I’ve decided to try and sum up the keys to the current market environment with a series of charts and graphs. I started out looking for five key charts. That quickly turned into ten. And before I knew it; I had a baker’s dozen. And frankly, I’m sure I’ve skipped some key stuff. So many messages, so little time!
The areas I focused on include the technical picture of the market, the state of the current trade, market valuations, the Fed/monetary policy, and the #GrowthSlowing theme. So, without further ado, let’s get to it.
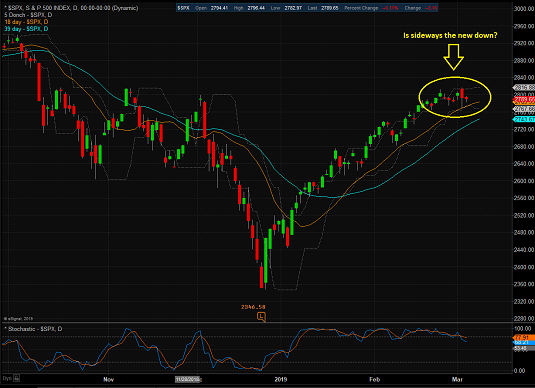
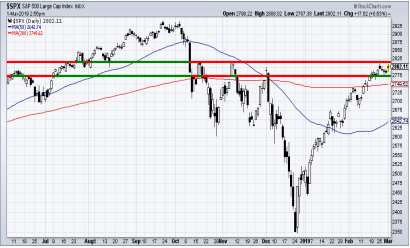
Looking at the technical picture, some analysts suggest we are currently experiencing a replay of last year’s Q1 market action. We had a very nasty/scary pullback that was followed by a return to rally mode and eventually, new highs. However, one thing that was missing from last year’s rebound were indications that there was some “oomph” behind the move. And as most analysts know, it is that “oomph” which usually accompanies a fresh leg of a major move.
The good news is…
The Message From the NAAIM Indicator Wall: This Market Has Serious “Mo”
By: National Association of Active Investment Managers
Updated: 2.17.19
The NAAIM Indicator Wall provides a weekly update to a robust array of stock market indicators. The “wall” includes readings and explanations of indicators and/or models in the areas of price/trend, momentum, key price levels, overbought/sold readings, sentiment, monetary, economic, inflation, and market cycles.
This week, we’re featuring the Momentum Indicators Board, which is a group of longer-term models designed to tell us whether there is any “oomph” behind the current trend.
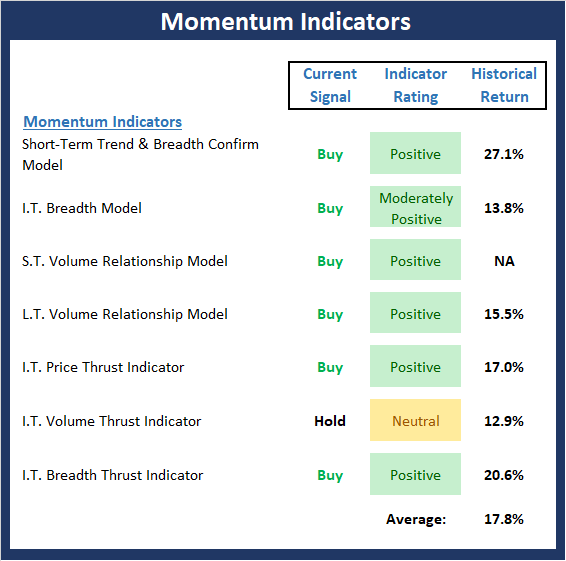
Our take is the Momentum board currently suggests that momentum remains strong and a buy-the-dip approach remains appropriate (assuming there will be a dip at some point).
Note: The Indicator Wall is a benefit provided to NAAIM Members and is password protected. To obtain a temporary password, contact NAAIM at 888-261-0787.
Is This The Pullback?
By: Paul Schatz, Heritage Capital LLC
Published: 3.1.19
All last week, analysts talked about stocks being in pullback mode. But honestly, this sure doesn’t feel like a pullback. What is the S&P 500 down from its intra-day peak? Not even 1%. Overnight trading suggests a test of 2019 highs. Again, when the masses have been sitting in so much cash all year, waiting for stocks to go down 5%, 10% and 15%, it provides a strong cushion against such a decline. The slightest bit of weakness continues to be bought, until it isn’t. And then a real pullback will begin.
This slight pause in the major indices hasn’t even touched any short-term determinants of trend. No glaring internal weaknesses. No sector warnings. No nothing. The test will come at the end of the day if stocks are near 2019 highs.
What is Already Baked In?
By: Jeffrey Miller Dash of Insight
Published: 3.3.19

After the events of the last three months, many are wondering about two different questions: (1) What is the most likely outcome for several key matters? (2) What outcome is expected, and therefore already factored into current market prices?
Economists say that these outcomes are “discounted” by which they mean already reflected. This is confusing since the ordinary definition implies that the outcomes are ignored. The punditry prefers “baked in,” so they will be asking: What is already baked into current market prices?
This is a wonderful topic since it is important, but strictly a matter of opinion. There is no way to know in advance the aggregated decision of millions of market participants. Here are some key items for dispute, including my guesses about the prevailing market belief. My personal conclusions…
Update: The NAAIM Dynamic Allocation Model
Designed to be a value-add benefit to membership, NAAIM offers a Dynamic Asset Allocation Model based on the NAAIM Indicator Wall of indicators and models. The overall objective of the model portfolio is to dynamically adapt to changing market environments and to keep equity exposure in line with current conditions. The model targets a normalized allocation of 60% stocks and 40% Bonds.
Here is this week’s model allocation:
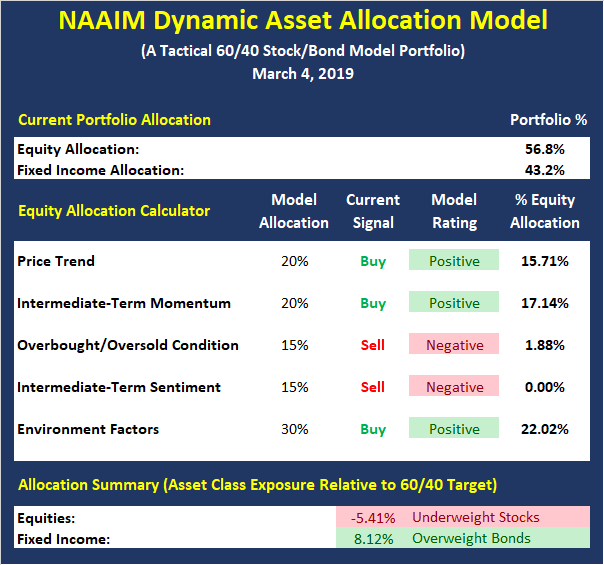
The model has been run live on the NAAIM website for several years and has demonstrated the ability to reduce exposure to market risk during negative environments such as those seen in 2015-16 and 2018.
The NAAIM Dynamic Allocation Model is for illustrative and informational purposes only, and does not in any way represent an endorsement by NAAIM or an investment recommendation.
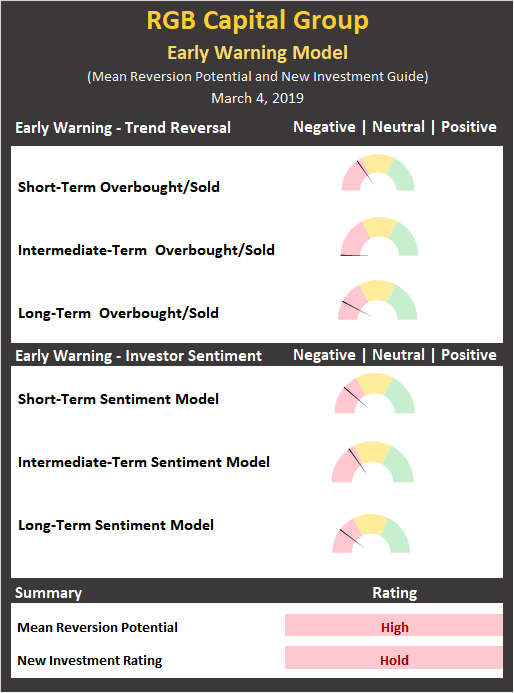
Introducing Our New “Early Warning” Model
By: Rob Bernstein, RGB Capital Group
Published: 3.2.19
We are pleased to introduce a new research tool available to our followers: The RGB Capital Early Warning Model.
Designed to provide insight into the potential for counter-trend moves as well as a guide to new investable assets, the model focuses on both overbought/sold and sentiment models. Take a look…
Link to the Latest RGB Perspectives
The Running of the Bulls
By: Sam and Bo Bills, Bills Asset Management
Published: 3.1.19
The resiliency of this market is nothing short of astounding. Despite a number of reasons why it should enter a period of correction, it simply continues marching on. If the bears are going to state their case, the current market area is their last best chance to do so before a climb to the highs of 2018. Continued optimism of a soon to be announced trade deal with China is the common reasoning behind the markets recent moves. We don’t disagree but think a trade deal is mostly priced into the market. Any failure to reach such a deal and/or the continuing or expansion of tariffs will likely lead to a sharp selloff. With earnings season mostly behind us, trade talks, economic measures, and the Fed’s interest rate tone will be the drivers over the coming month.
Happy Birthday!
By: Dexter P. Lyons, Issachar Fund
Published: 3.4.19

This week will mark the 10th anniversary of the market bottom when the S&P 500 Index bottomed out at “666”. In Biblical terms, “666” is the “Mark of the Beast” (devil). Yes, it may have been a devilish scary bottom, but the Fed rescued the market with Quantitative Easing (QE) and lower rates that the market now appears “hooked” on. I believe that we are still under some form of QE and when the Fed does take his foot off the QE pedal, we will likely have “he!!” to pay. However, we do not appear to be there yet so letss just enjoy the ride while it lasts.
FOMO At Its Finest
By: Ryan Redfern, Shadowridge Asset Management
Published: 2.28.19

Wow, this year isn’t going as many investors and investment managers predicted. But that might be a good thing. Surprisingly, I’ve found that I’ve been one of the more aggressive managers so far this year, getting fully (or nearly fully) back into the stock markets as early as the beginning of January.
What makes this interesting to us is that it seems many investors (both institutional and retail) haven’t yet gotten back into the market after playing it safe at the end of last year. At some point, we could see some FOMO (Fear of Missing Out) drawing more money into this market to make it go even higher…
Weekly Update: The NAAIM Member Exposure Index
The NAAIM Exposure Index represents the average exposure to US Equity markets as reported by our members in the organization’s weekly survey. Note that many NAAIM members are risk managers and tend to reduce exposure to the markets during high risk environments.
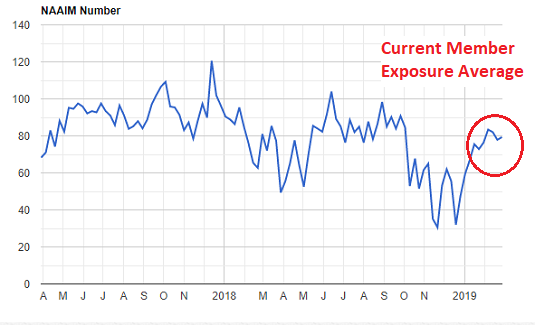
More on the NAAIM Exposure Index
NOT INVESTMENT ADVICE. The analysis and information in this report and on our website is for informational purposes only. No part of the material presented in this report or on our websites is intended as an investment recommendation or investment advice. Neither the information nor any opinion expressed nor any Portfolio constitutes a solicitation to purchase or sell securities or any investment program. The opinions and forecasts expressed are those of the editors and may not actually come to pass. The opinions and viewpoints regarding the future of the markets should not be construed as recommendations of any specific security nor specific investment advice. Investors should always consult an investment professional before making any investment.


