NAAIM Speaks is monthly newsletter containing market insights and analysis from NAAIM member firms. This newsletter is designed to provide a plethora of market analysis, indicators, some occasional humor, as well as a summary of NAAIM’s proprietary Dynamic Asset Allocation Model and Managers Exposure Index. The report is for informational uses only and is not to be construed as investment advice.
2023 Sticking to the Script
By: David Moenning, Heritage Capital Research
Published: 9.8.23

After enjoying a strong run higher from mid-March through the end of July, the bulls took a much deserved and highly anticipated break. And in following the seasonal script, the major indices proceeded to pull back in August. Although it wasn’t fun, the decline was definitely to be expected. The good news is that unless the bears are firmly in control at the corner of Broad and Wall, these annoying pullback phases eventually run their course. Oftentimes like clockwork…
Bulls Not Convincing, Yet
By: Paul Schatz, Heritage Capital LLC
Published: 9.11.23

Stocks are in the midst of what I think will end up being a feeble bounce. Sure, I could be grossly wrong and the final bottom is in for 2023 and the bulls are off to the races again. I don’t think that is going to happen, but it’s possible. Rather, I still believe there is one more decline coming and it’s right in front of us. If stocks exceed the September highs in the coming few weeks, then I will be wrong and need to pivot quickly and accordingly…
Taking a Break
By: Ryan C. Redfern ShadowRidge Asset Management
Published: 8.25.23

As August began, it wasn’t much of a surprise to see the market start to pull back a bit from its over-stretched and over-bought conditions. The stock market can only run up (or down) like that for so long before it needs to take a break. It often reverts back to an average price of the past month (or 21-day moving average), and that is what we saw play out over the past few weeks.
And let’s not forget that seasonality is a relevant factor to keep in mind…
The Message From the NAAIM Indicator Wall
By: National Association of Active Investment Managers
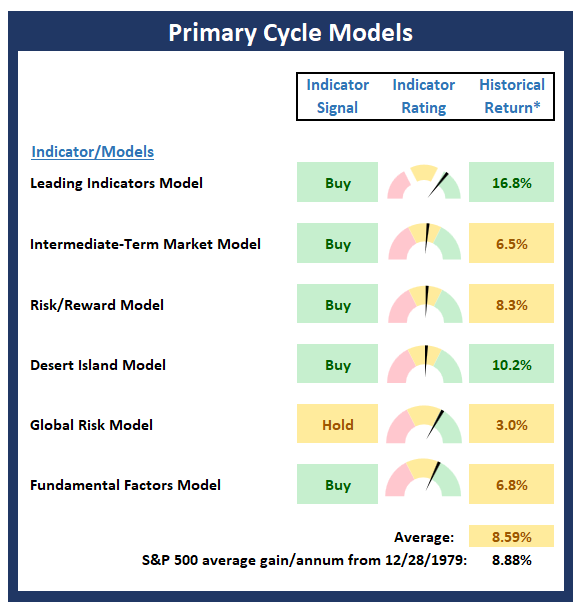
The NAAIM Indicator Wall provides a weekly update to a robust array of stock market indicators. The “wall” includes readings and explanations of indicators and/or models in the areas of price/trend, momentum, key price levels, overbought/sold readings, sentiment, monetary, economic, inflation, and market cycles.
This time, we’re featuring the Primary Cycle Board , which is designed to identify the primary trend of the overall “state of the stock market.”
Note: The Indicator Wall is a benefit provided to NAAIM Members and is password protected. To obtain a temporary password, contact NAAIM at 888-261-0787.
Waiting on Additional Information
By: Rob Bernstein, RGB Capital Group
Published: 9.11.23

It appears that the market is digesting its recent gains and waiting for additional data on inflation, corporate earnings and
interest rate policy. These are likely to be the primary drivers of the stock market through the end of the year…
Good News: Momentum Still Positive
By: Craig Thompson, President Asset Solutions
Published: 9.4.23
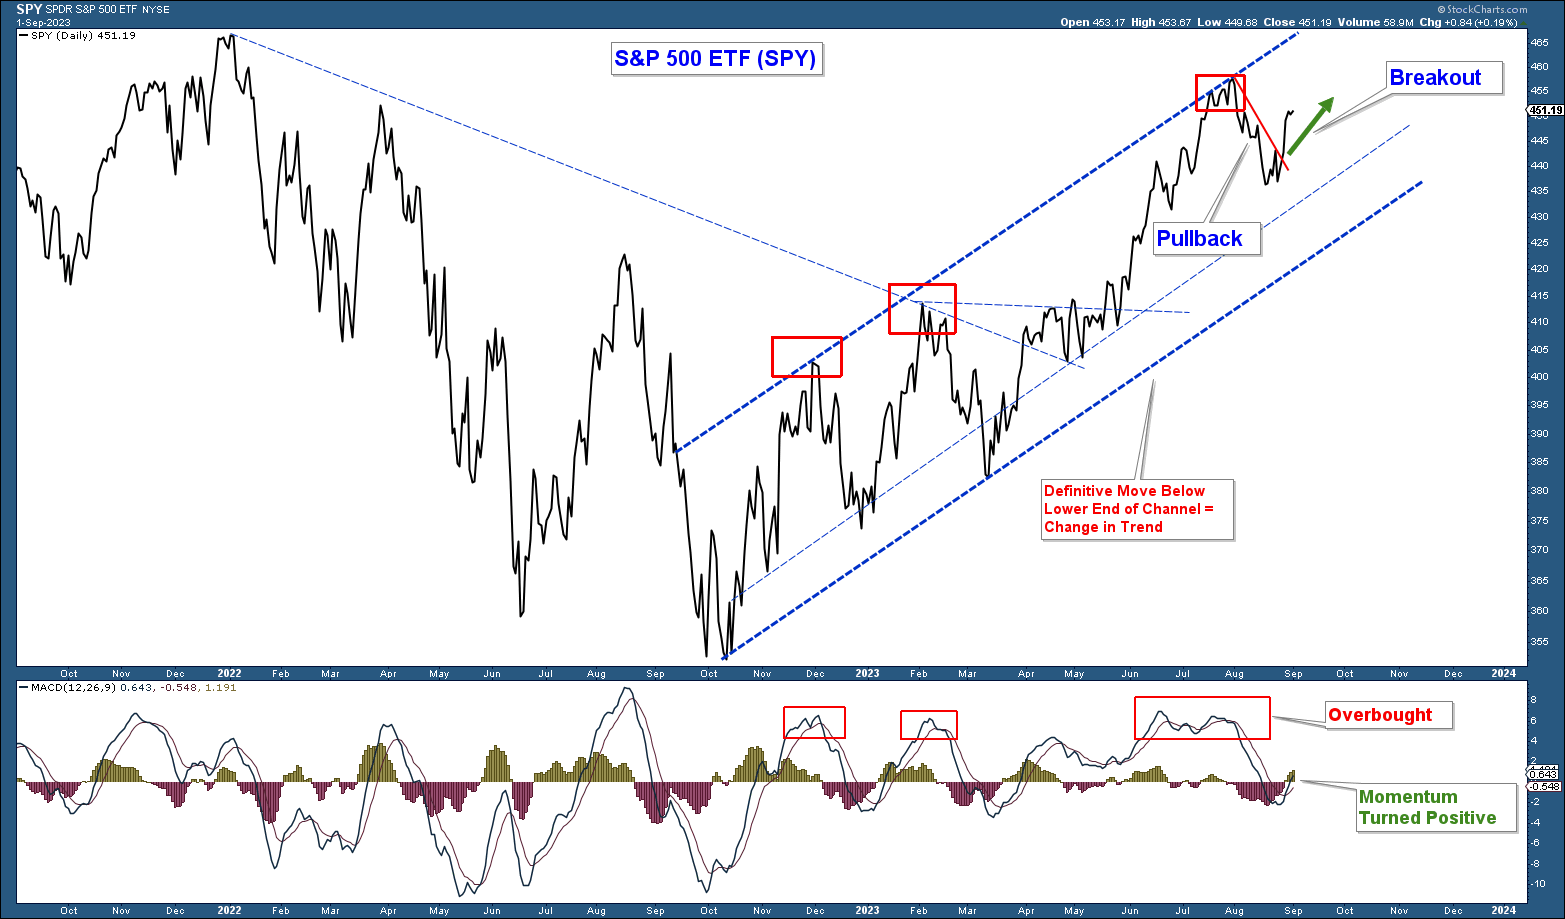
As long as price continues to advance within the recent uptrending channel, market conditions are positive from a price perspective. The August move to the middle/lower end of the channel combined with a positive move higher in momentum suggests that odds favor higher stock prices in the near term…
The NAAIM Dynamic Allocation Model
Designed to be a value-add benefit to membership, NAAIM offers a Dynamic Asset Allocation Model based on the NAAIM Indicator Wall of indicators and models. The overall objective of the model portfolio is to dynamically adapt to changing market environments and to keep equity exposure in line with conditions. The model targets a normalized allocation of 60% stocks and 40% Bonds.
Here is this week’s model allocation:
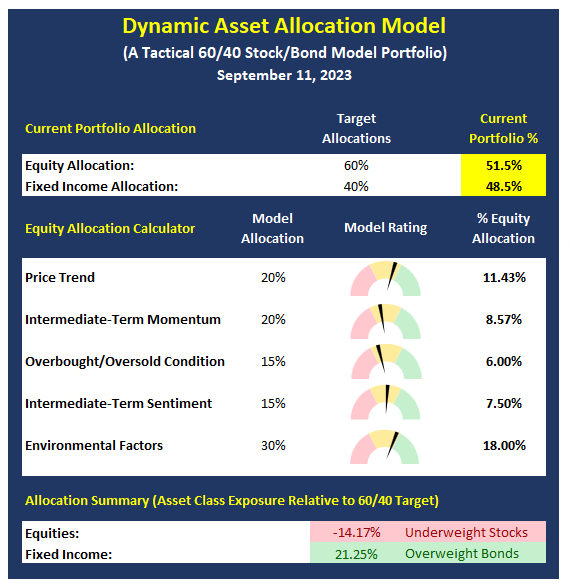
The model has been run live on the NAAIM website for several years and has demonstrated the ability to reduce exposure to market risk during negative environments such as those seen in 2015-16 and 2018.
More on the Dynamic Allocation Model and Historical Readings
The NAAIM Dynamic Allocation Model is for illustrative and informational purposes only, and does not in any way represent an endorsement by NAAIM or an investment recommendation.
Cloudy With a Chance of Sunshine
By: Sam and Bo Bills Bills Asset Management
Published: 9.8.23

September’s negative reputation has proven true to this point with all of the major indices down for the week. The declines
have been modest thus far, but we still have much of the month to get through. With earnings season past, the market will
turn most of its attention to economic reports and the perceived effects those reports might have on Fed policy. Next week we
will get another round of CPI and PPI reports to get a gauge on where inflation is headed next…
On the 50!
By: Dexter P. Lyons Issachar Fund
Published: 9.11.23

The S&P 500 and NASDAQ 100 indexes are trading near their respective 50-day moving averages (DMA), so the uptrend has flat-lined. My conviction level is low, so I do not plan to invest more in growth stocks until the market changes character and starts rewarding risk. Risk is the only thing we can attempt to control. The market decides everything else, and we are ready to get “all in” when the charts say so…
The NAAIM Member Exposure Index
The NAAIM Exposure Index represents the average exposure to US Equity markets as reported by our members in the organization’s weekly survey. Note that many NAAIM members are risk managers and tend to reduce exposure to the markets during high risk environments.
Click To See the Current Exposure Index
NOT INVESTMENT ADVICE. The analysis and information in this report and on our website is for informational purposes only. No part of the material presented in this report or on our websites is intended as an investment recommendation or investment advice. Neither the information nor any opinion expressed nor any Portfolio constitutes a solicitation to purchase or sell securities or any investment program. The opinions and forecasts expressed are those of the editors and may not actually come to pass. The opinions and viewpoints regarding the future of the markets should not be construed as recommendations of any specific security nor specific investment advice. Investors should always consult an investment professional before making any investment.
Tags: NAAIM, NAAIM Speaks, Stocks market analysis, Stock Market Analysis, Stock market, stock market indicators, David Moenning, Heritage Capital Research, Paul Schatz, Heritage Capital LLC, Rob Bernstein, RGB Capital Group, Ryan Redfern, Shadowridge Asset Management, Sam Bills, Bo Bills, Bills Asset Management, Dexter Lyons, Issachar Fund, Jim Lee, Stratfi, Craig Thompson, Asset Solutions, NAAIM Exposure Index, NAAIM Dynamic Allocation Model