NAAIM Speaks is monthly newsletter containing market insights and analysis from NAAIM member firms. This newsletter is designed to provide a plethora of market analysis, indicators, some occasional humor, as well as a summary of NAAIM’s proprietary Dynamic Asset Allocation Model and Managers Exposure Index. The report is for informational uses only and is not to be construed as investment advice.
Things Are Starting to Break
By: David Moenning, Heritage Capital Research
Published: 10.3.22

Just about everywhere you look, markets have been breaking down. Primarily on the back of the idea that a global recession is not fully baked into current prices. But that’s actually not the point I’d like to make on this fine Monday morning. No, what I’m referring to in the title of this morning’s market missive is that it appears we’ve entered the “things are starting to break” mode of this nasty bear market cycle….
New Bull Market or Just Another Bounce?
By: Paul Schatz, Heritage Capital LLC
Published: 10.6.22

The market has definitely changed to a bullish tenor, at least in the very short-term. Bulls seem very interested and selling has dried up, at least for now. And there was historic power behind the rallies on Monday and Tuesday. Now, we try to ascertain whether this is just another short, sharp rally in an ongoing bear market or the beginning of something bigger and perhaps major….
How Bad Can It Get?
By: Ryan C. Redfern ShadowRidge Asset Management
Published: 09.30.22

Opportunity ahead? With every market sell-off or bear market comes an eventual rebound, which can be significant. Several market bottoms have occurred in October, so it is entirely possible this bear market could end in the next few weeks. Or maybe we get another rally into the end of the year. However, it is now highly unlikely that the S&P or the US Bond markets will end the year positive – the question is, how bad can it get, or how much can it recover in a short period of time?
The Message From the NAAIM Indicator Wall
By: National Association of Active Investment Managers
Updated: 07.01.2022
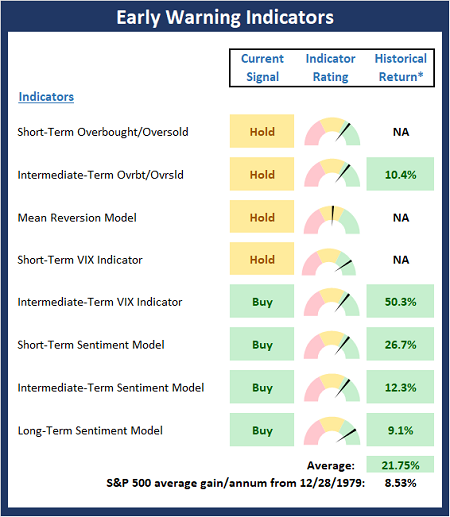
The NAAIM Indicator Wall provides a weekly update to a robust array of stock market indicators. The “wall” includes readings and explanations of indicators and/or models in the areas of price/trend, momentum, key price levels, overbought/sold readings, sentiment, monetary, economic, inflation, and market cycles.
This time, we’re featuring the Early Warning Board , which is designed to suggest when the market may be ripe for a reversal on a short-term basis.
Note: The Indicator Wall is a benefit provided to NAAIM Members and is password protected. To obtain a temporary password, contact NAAIM at 888-261-0787.
What The Junk Market is Telling Me Now
By: Rob Bernstein, RGB Capital Group
Published: 10.3.22

As many of you know, I follow the BAML High-Yield Master II Index (junk bond index) as an indicator of overall market risk.
When junk bonds decline, it is generally an indication that market risk is high. In this type of environment, junk bond
investors demand higher yields to compensate them for that additional risk. As bond yields and prices are inversely
correlated, the higher yields cause junk bond prices to fall. We can see this repeating pattern over the last 20+ years in the
chart above. Each time the market faced a significant crisis, junk bond prices fell along with other risk assets (i.e. stocks).
Eventually the market forces driving the market decline will dissipate creating an environment of declining yields and higher
junk bond prices in the future…
Buckle Up
By: Craig Thompson, President Asset Solutions
Published: 10.3.22

The pervading theme amongst many notable macroeconomic experts is that the continued dislocation in the bond market (too many sellers of bonds and not enough buyers) which has resulted in rising yields as stocks have fallen will result in a crisis. This is not far-fetched and the canary in the coal mine could be what we just saw play out in the UK….
The NAAIM Dynamic Allocation Model
Designed to be a value-add benefit to membership, NAAIM offers a Dynamic Asset Allocation Model based on the NAAIM Indicator Wall of indicators and models. The overall objective of the model portfolio is to dynamically adapt to changing market environments and to keep equity exposure in line with conditions. The model targets a normalized allocation of 60% stocks and 40% Bonds.
Here is this week’s model allocation:
The model has been run live on the NAAIM website for several years and has demonstrated the ability to reduce exposure to market risk during negative environments such as those seen in 2015-16 and 2018.
More on the Dynamic Allocation Model and Historical Readings
The NAAIM Dynamic Allocation Model is for illustrative and informational purposes only, and does not in any way represent an endorsement by NAAIM or an investment recommendation.
Buy-The-Dip Has Become…
By: Sam and Bo Bills Bills Asset Management
Published: 09.30.22

The buy the dip crowd has become the sell
the bounce crowd. It is a noteworthy change and a
reflection of the realization by investors that the Fed
won’t or can’t put a floor under this market. The
S&P is just below the lows of the year and are in
danger of losing that level. We don’t believe it is a
matter of if that level is broken but when it is
broken…
It’s Not Over!
By: Dexter P. Lyons Issachar Fund
Published: 10.3.22

This is a Bear Market and Recession, and it ain’t over yet! The market is discounting an inflationary bad 3rd quarter earnings season, and looking ahead, it sees more of the same. Indexes trend higher when they see a clear path to earnings growth, but very few fundamentally strong stock charts look attractive currently. Even the best stocks that have held up well will likely get hit in the next wave of capitulation selling. Cash is king! It is not what you make in a Bull Market but what you keep in a Bear Market that truly allows one to invest/save for the long term. …
The NAAIM Member Exposure Index
The NAAIM Exposure Index represents the average exposure to US Equity markets as reported by our members in the organization’s weekly survey. Note that many NAAIM members are risk managers and tend to reduce exposure to the markets during high risk environments.
Click To See the Current Exposure Index
NOT INVESTMENT ADVICE. The analysis and information in this report and on our website is for informational purposes only. No part of the material presented in this report or on our websites is intended as an investment recommendation or investment advice. Neither the information nor any opinion expressed nor any Portfolio constitutes a solicitation to purchase or sell securities or any investment program. The opinions and forecasts expressed are those of the editors and may not actually come to pass. The opinions and viewpoints regarding the future of the markets should not be construed as recommendations of any specific security nor specific investment advice. Investors should always consult an investment professional before making any investment.
Tags: NAAIM, NAAIM Speaks, Stocks market analysis, Stock Market Analysis, Stock market, stock market indicators, David Moenning, Paul Schatz, Rob Bernstein, Ryan Redfern, Sam Bills, Bo Bills, Dexter Lyons, Craig Thompson, NAAIM Exposure Index, NAAIM Dynamic Allocation Model


