


NAAIM Speaks is monthly newsletter containing market insights and analysis from NAAIM member firms. This newsletter is designed to provide a plethora of market analysis, indicators, some occasional humor, as well as a summary of NAAIM’s proprietary Dynamic Asset Allocation Model and Managers Exposure Index. The report is for informational uses only and is not to be construed as investment advice.
The Correction Will End When…
By: David Moenning, Heritage Capital Research
Published: 10.13.21

It is said that stock market corrections are only “normal and healthy” until you are in the middle of one. The problem is it can be tough to see the bright side of the macro picture when volatility begins spiking, prices start to crater (and then recover, and then crater again), and all kinds of scary arguments/narratives start to be made in the popular financial media…
Still Calling for All-Time Highs
By: Paul Schatz, Heritage Capital LLC
Published: 10.13.21

So far, at its worst, the S&P 500 declined 5.5% on a closing basis, not exactly the carnage that has been portrayed in the media by the pundits. Stocks have reacted very well to the plethora of bad news, like the debt ceiling, Evergrande, Delta variant, supply chain and inflation. And remember, it’s not the actual news, but how markets react…
Sticking To The Script
By: Ryan C. Redfern ShadowRidge Asset Management
Published: 9.30.21
Historically, September has the highest odds of a negative stock market return out of all the months of the year. And as if on cue, this year it is no different. The S&P 5001 drifted lower at a fairly slow pace and then accelerated into the last half of the month. It “only” had a drawdown (from prior high to new low) of about 4.01% (FastTrack Data). And while that is one of the “larger” pullbacks we’ve had in the last year, it is still shallower than what we’d think of as “typical” for this volatile month. …
The Message From the NAAIM Indicator Wall
By: National Association of Active Investment Managers
Updated: 10.11.21
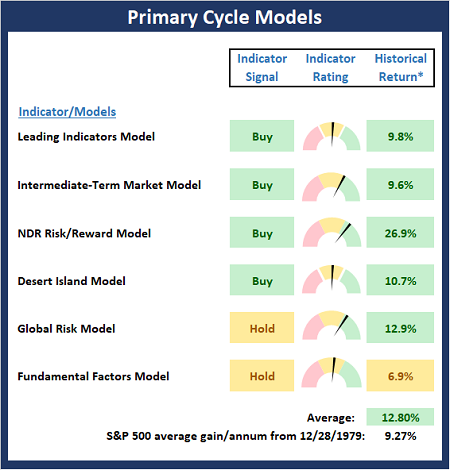
The NAAIM Indicator Wall provides a weekly update to a robust array of stock market indicators. The “wall” includes readings and explanations of indicators and/or models in the areas of price/trend, momentum, key price levels, overbought/sold readings, sentiment, monetary, economic, inflation, and market cycles.
This time, we’re featuring the Primary Cycle Indicator Board , which is designed to determine the “state” of the overall market.
Note: The Indicator Wall is a benefit provided to NAAIM Members and is password protected. To obtain a temporary password, contact NAAIM at 888-261-0787.
A Trend in Jeopardy
By: Rob Bernstein, RGB Capital Group
Published: 10.11.21

Many of the major stock market indices bounced nicely last week but that bounce didn’t change the current trends of the
market. A continuation of the rebound in equities this week will put the intermediate-term downtrend in jeopardy…
Risk Has Turned Decidedly Higher
By: Craig Thompson, President Asset Solutions
Published: 10.3.21
September was a down month for the stock market and market risk has turned decidedly higher. For a number of months, we have seen the S&P 500 grind higher while waning market breadth continued to warn of internal market weakness. Over the past month, the market finally broke down….
The NAAIM Dynamic Allocation Model
Designed to be a value-add benefit to membership, NAAIM offers a Dynamic Asset Allocation Model based on the NAAIM Indicator Wall of indicators and models. The overall objective of the model portfolio is to dynamically adapt to changing market environments and to keep equity exposure in line with conditions. The model targets a normalized allocation of 60% stocks and 40% Bonds.
Here is this week’s model allocation:
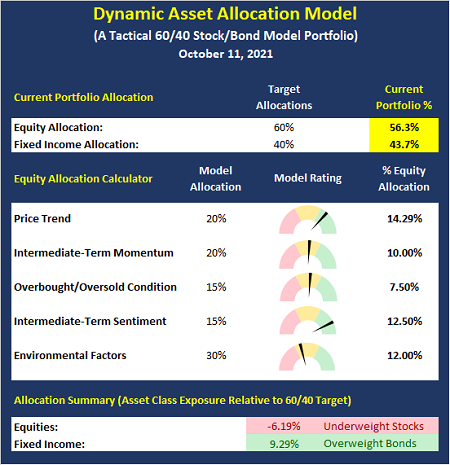
The model has been run live on the NAAIM website for several years and has demonstrated the ability to reduce exposure to market risk during negative environments such as those seen in 2015-16 and 2018.
More on the Dynamic Allocation Model and Historical Readings
The NAAIM Dynamic Allocation Model is for illustrative and informational purposes only, and does not in any way represent an endorsement by NAAIM or an investment recommendation.
Kicking The Can
By: Sam and Bo Bills Bills Asset Management
Published: 10.7.21

The market has bounced a little this week as Congress looks to have struck a short-term solution to the debt limit. The can is kicked down the road and we will need to deal with this again in December but, for now, the market has breathed a sigh of relief. Removing one of the uncertainties is good but many more remain. The jobs report that is due out before Friday’s open could be a market mover. It will be interesting to see how the market reacts to the report….
Signs of Potential Danger
By: Dexter P. Lyons Issachar Fund
Published: 10.11.21

No one knows where the market is headed, but we have warning signs of potential danger! My favorite risk indicator is the junk bond market. When the stock market senses higher risk, I have found that the junk bond market trades below its 50-DMA on higher above-average volume, as it is now. When investors lose their appetite for risk, they tend to sell the higher-yielding bonds and buy the safer US Treasury bonds causing yields to drop. However…
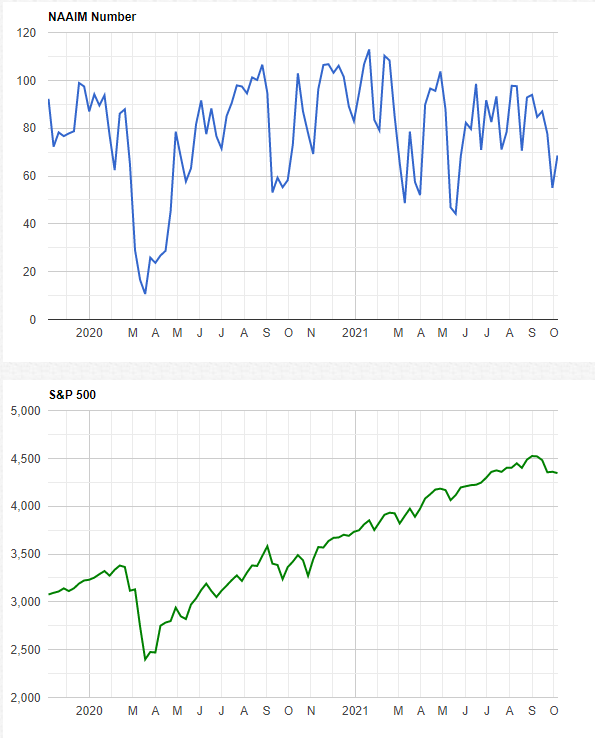
The NAAIM Member Exposure Index
The NAAIM Exposure Index represents the average exposure to US Equity markets as reported by our members in the organization’s weekly survey. Note that many NAAIM members are risk managers and tend to reduce exposure to the markets during high risk environments.
NOT INVESTMENT ADVICE. The analysis and information in this report and on our website is for informational purposes only. No part of the material presented in this report or on our websites is intended as an investment recommendation or investment advice. Neither the information nor any opinion expressed nor any Portfolio constitutes a solicitation to purchase or sell securities or any investment program. The opinions and forecasts expressed are those of the editors and may not actually come to pass. The opinions and viewpoints regarding the future of the markets should not be construed as recommendations of any specific security nor specific investment advice. Investors should always consult an investment professional before making any investment.
Tags: NAAIM, NAAIM Speaks, Stocks market analysis, Stock Market Analysis, Stock market, stock market indicators, David Moenning, Paul Schatz, Rob Bernstein, Ryan Redfern, Sam Bills, Bo Bills, Dexter Lyons, Craig Thompson, NAAIM Exposure Index, NAAIM Dynamic Allocation Model


