


The New Herd Behavior
By: David Moenning, Heritage Capital Research
Published: 2.4.19

Image Credit: Franklin Templeton Funds
“Herd behavior, or the tendency of individuals in a group to ‘follow the trend,’ has frequently been observed in equity markets. Herd behavior in investors leads to a convergence of action.” [Yan, Zhao, Sun (2012)]
“Theoretical models on herd behavior predict that under different assumptions, herding can bring prices away (or towards) fundamentals and reduce (or enhance) market efficiency.” [Yan, Zhao, Sun (2019)]
For anyone still shaking their head over the recent eye-popping, one-way trends in the stock market, the academic assessments of “herd behavior” above may provide one of the best summations I’ve seen.
Or, if you prefer something a little more pop culture oriented, there is Eddie Vedder’s view on the subject from the 1996 Pearl Jam hit Do The Evolution… “I’m the man buying stocks on the day of the crash… It’s herd behavior, uh huh, it’s evolution, baby.” (P.S. If you are looking for a little kick-start to your day, this video will definitely do the trick.)
Blame It On The Computers?
To be clear, I have never been involved with a high-speed or high-frequency trading shop. As such, I have to admit that I do not know all the ins and outs of how today’s algorithmic trading programs function – or even what triggers them. However, I have done a fair amount of research on the subject and as such, I am pretty confident that algo-induced herd behavior had a hand in both the slow-motion crash that occurred between 12/4 and 12/24 and the ensuing joyride to the upside that began on 12/26.
I know, I know. We can’t blame everything on the computers. But…
The NAAIM Indicator Wall
By: National Association of Active Investment Managers
Updated: 2.4.19
The NAAIM Indicator Wall provides a weekly update to a robust array of stock market indicators. The “wall” includes readings and explanations of indicators and/or models in the areas of price/trend, momentum, key price levels, overbought/sold readings, sentiment, monetary, economic, inflation, and market cycles.
This Week’s Message From The Wall: Be Ready to Buy The Dips
This week, we’re featuring the Market Momentum Board, which is a group of indicators and models designed to tell us whether there is any “oomph” behind the current trend..

The fact that the Momentum board is awash in green this week is an excellent indication that the recent rally, which has gained more than 15% in just 5 weeks, definitely has some oomph behind it. This may be due to the abrupt change in the Fed’s policy or the increasing hopes for a trade deal with China. But in any event, the momentum favors the bulls and suggests a buy-the-dip environment has returned.
Note: The Indicator Wall is a benefit provided to NAAIM Members and is password protected. To obtain a temporary password, contact NAAIM at 888-261-0787.
Looking Beyond The Obvious
By: Jeffrey Miller Dash of Insight
Published: 2.3.19
We have a small economic calendar, but another big week for earnings. Corporate earnings are not confirming those who thought the market was signaling a recession. Starved for something new to worry about, the punditry has turned to reductions in earnings estimates. This newfound interest in forward earnings provides another dimension for the gloomy set. Instead, I suggest that astute investors should consider the data while… looking beyond the obvious.
Using earnings season as the main theme, I will suggest some easy ways to accomplish this goal.
Use Expected Earnings: The most compelling reason is that it works better than either current earnings or formulaic analysis of past earnings. As earnings season unfolds, you see plenty of emphasis on guidance and outlook and little discussion of things that happened ten years ago. If this is how the market evaluates individual companies, why should we expect a different approach to the resulting broad averages? FactSet regularly runs this chart which shows the relevance of forward earnings for markets. Note that it is a constantly moving 12-month forward look, not the fixed calendar approach used by most sources.

Next, it is important to Choose The Right Time Frame…
Monster Report, But…
By: Paul Schatz, Heritage Capital LLC
Published: 2.1.19

As I sat down to craft today’s piece just after the January jobs report was released, I found myself sidetracking from the short-term reaction to the report to a sort of state of the markets if you will. So, I went with it, writing for several hours on where stocks stand today. I will publish that early next week.
Today, I was shocked when I heard that the economy created more than 300,000 new jobs in January, almost double what economists predicted. I thought it was a typo. Did the shutdown somehow screw up the data? Were government workers exactly a little revenge? Then I saw very little reaction in pre-market trading so I knew something else was up. A number like 300,000 isn’t normally seen at this stage in the cycle.
Well, it turns out that while the 304,000 was correct, the December and November reports were revised downward by a total of 70,000 jobs, still making the three month average a whopping 240,000. This is beyond great news for any economy, let alone one more than 10 years into an expansion. Even better, wages continued to grow by more than 3%, the number that naysayers have focused on for more than a decade.
Why is this happening so late in the economic cycle?
The Wall of Worry
By: Rob Bernstein, RGB Capital Group
Published: 2.4.19
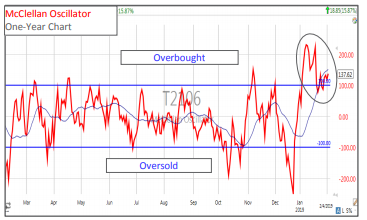
It is said that the market likes to climb a wall of worry. In today’s environment we have concerns over trade negotiations with China, slowing global growth, political dysfunction in Washington D.C. and an overbought stock
market to name a few.
However, one concern I have for the current market environment is that the market remains overbought on a short-term basis. The McClellan Oscillator has been sitting in overbought territory (> +100) for most of the month of January. While this overbought condition can persist for a period of time, at some point the market will need to work off this overbought condition. …
Update: The NAAIM Dynamic Allocation Model
Designed to be a value-add benefit to membership, NAAIM offers a Dynamic Asset Allocation Model based on the NAAIM Indicator Wall of indicators and models. The overall objective of the model portfolio is to dynamically adapt to changing market environments and to keep equity exposure in line with current conditions. The model targets a normalized allocation of 60% stocks and 40% Bonds.
Here is this week’s model allocation:
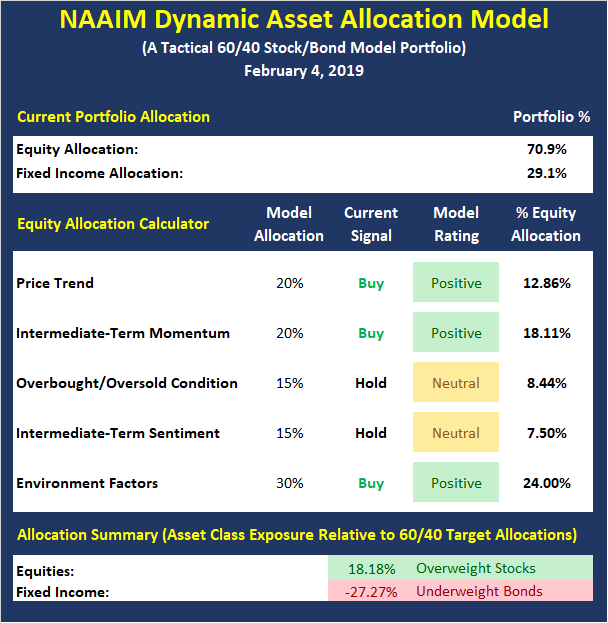
The model has been run live on the NAAIM website for several years and has demonstrated the ability to reduce exposure to market risk during negative environments such as those seen in 2015-16 and 2018.
COMING SOON: The model is currently shown within the NAAIM Indicator Wall but will soon be an option in the “Programs” Tab of the NAAIM.org website.
The NAAIM Dynamic Allocation Model is for illustrative and informational purposes only, and does not in any way represent an endorsement by NAAIM or an investment recommendation.
The Big Money is Coming Back In
By: Dexter P. Lyons Issachar Fund
Published: 2.4.19

The Fed released a dovish (low rates) policy statement on Wednesday and the market shot higher in price on above-average volume! I now have conviction that the institutions “big money” is coming back in this market after being on “pause” since the Fed’s rate hike in December.
The Fed mentioned “patience” eight times in its policy statement signaling that it may have raised rates in December prematurely. The market seems to like the new “tone” of the Fed. I believe the Fed has re-filled the “party punch bowl” sending a signal to the market that QE is not dead and it is very much still alive.
We just had our best January in 30 years linked to a “dovish” Fed. Let’s pray the Fed keeps “cooing” like a dove…
The Landscape Has Changed
By: Sam and Bo Bills Bills Asset Management
Published: 2.1.19
After the worst December performance since the Great Depression, the market has turned in one of the best January’s in recent memory. The rise has continued unabated with virtually no pullbacks or rest to allow those that were out of the market in December a reasonable opportunity to move back into the markets. The market has been fueled by optimism that a trade deal with China is moving in the right direction and, more importantly, a suddenly dovish Fed sounding like there are no more rate hikes in 2019. 6 weeks ago the Fed was contemplating 2-3 rate hikes in 2019. It has been a remarkable 180 degree turn by the Fed that caught many off guard – us included.
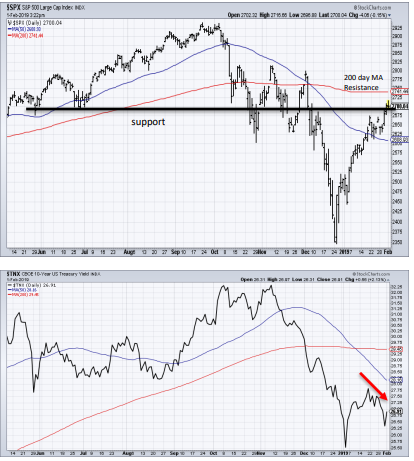
By any measure January was a good month for the major averages. The rise upward began the day after Christmas and has barely skipped a beat over the ensuing month. Despite the surge, the S&P remains 8% below where it closed in September of last year illustrating the depth of the decline in the 4th quarter of 2018. The landscape has changed since late 2018 with a Fed now signaling a much more dovish posture. Chairman Powell’s abrupt change points to how political this position is despite its charge of being independent…
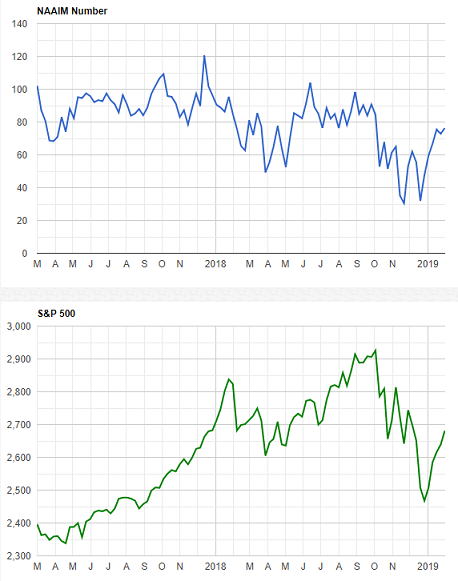
Update: The NAAIM Member Exposure Index
The NAAIM Exposure Index represents the average exposure to US Equity markets as reported by our members in the organization’s weekly survey. Note that many NAAIM members are risk managers and tend to reduce exposure to the markets during high risk environments.
For example, at the beginning of October, with the stock market near all-time highs, the NAAIM Exposure Index stood at approximately 90%. However, by the end of November – and before December’s precipitous drop – the exposure index had dropped to 53.2%.