


The NAAIM Indicator Wall: Is It Time To Go The Other Way?
By: National Association of Active Investment Managers
Updated: 12.11.18
The NAAIM Indicator Wall provides a weekly update to a robust array of stock market indicators. The “wall” includes readings and explanations of indicators and/or models in the areas of price/trend, momentum, key price levels, overbought/sold readings, sentiment, monetary, economic, inflation, and market cycles.
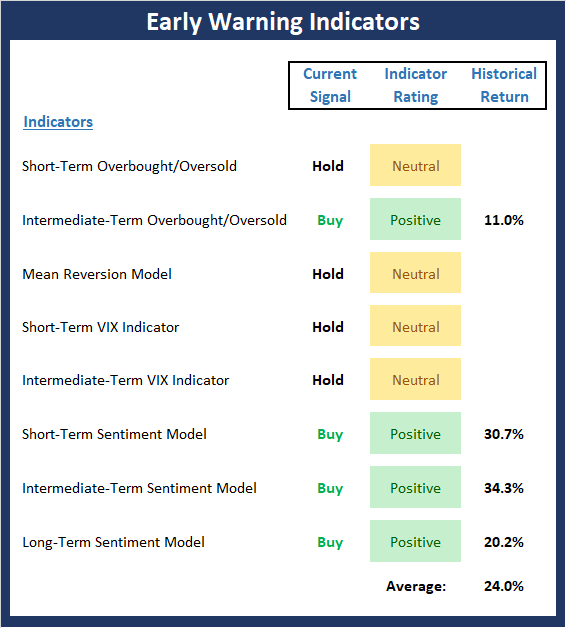
This week, we’re featuring the “Early Warning” Indicator Board, which is a group of indicators designed to suggest when the market may be ripe for a reversal on a short-term basis.
The key point at this time is that despite all the negativity in the market, our “early warning” indicators are suggesting that conditions for a bounce are definitely improving.
Note: The Indicator Wall is a benefit provided to NAAIM Members and is password protected. To obtain a temporary password, contact NAAIM at 888-261-0787.
Was That The “Soybean Bottom?”
By: David Moenning, Heritage Capital Research
Published: 12.11.18

It was another wild ride on Wall Street Monday. Stocks stumbled hard out of the gate, following the lead of most global markets. By 11:00am EST, the DJIA was down more than 500 points, had broken below the October lows, and appeared to be heading toward the next important level on the charts – the February lows.
Next came a small bounce, which was immediately tested with another sell program. For a change, the lows of the day held. After half an hour of sideways action, an actual rally ensued that would wind up erasing the day’s losses. And by the time the closing bell rang, the major indices sported small gains. So, as I wrote last week, All’s Well That Ends Well, Right?
Why The Turn?
The question of the day, of course, is, why did the market turn? Sure, stocks were very oversold and investor sentiment had become dour as just about everybody on the planet was now calling for another big drop in the stock market. Thus, the table was set for the bulls to get back in the game. But, as is usually the case, a trigger was needed to get things moving the other direction.
Global View Capital: Buckle Up!
Global View Capital Management
Published: 12.8.18
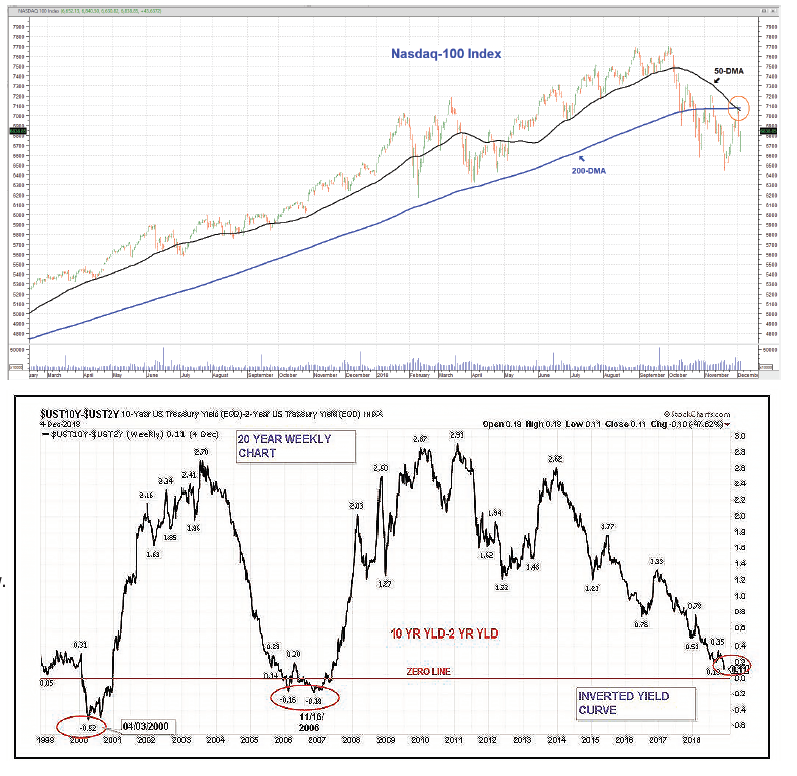
In the midst of all of this frenetic trading, we now have bearish “Death Crosses” flashing warning signs on almost all of the major indices. The “Death Cross” is Wall Street technical jargon for a chart pattern where the 50-Day Moving Average (short-term) trends down and penetrates the 200-Day Moving Average (long-term) [see Chart below]. In short, the “Death Cross” is bearish while its contra-cousin, the “Golden Cross”, is bullish. Currently, only the Dow Jones Industrial Average and S&P 500 Index have yet to trigger a “Death Cross.”
In addition, the expectation of an inverted yield curve (see below) has investors worried of recession. It has been noted in the financial media, ad nauseum, that an inverted yield curve always precedes a recession. However, historically, that lead time is anywhere from 6-24 months.
In other words, investors are confused and the emotions of fear and greed continue to wreak havoc on the markets.
Lots of Sectors Resist Decline & Many Seasonal Stats Point Higher
By: Paul Schatz, Heritage Capital LLC
Published: 12.11.18
The correction in stocks technically continued through last week although I remain firm in my opinion that this is all part of the bottoming process that began in October. With each passing week, more and more bulls turn to bears and I feel like I am almost alone in my forecast that new, all-time highs will be seen in 2019. While higher prices will be accompanied by unusually high volatility, I do not believe that a rising tide is going to lift all ships this time around. The number of haves and have nots should increase significantly.
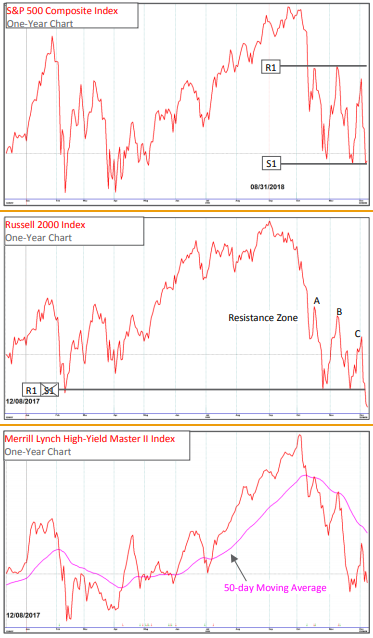
As four of the five major stock market indices are right around new lows, I think it’s telling that the NASDAQ 100 is not and bucking the trend. Additionally, a whole host of sectors are following suit, lending more credibility to my position that stocks are bottoming not accelerating to the downside. They include semiconductors, software, telecom, internet, discretionary, homebuilders, materials, staples, utilities, REITs, healthcare and biotech.
Turning back to the correction and bottoming process, it has now gone from being a simple one based on price action to a more complex one, not unlike the decline we saw in Q1 of this year.
Dash of Insight: Ready For Your Holiday Shopping?
By: Jeffrey Miller Dash of Insight
Published: 12.8.18
We have a normal week for news with the emphasis on inflation data and business optimism. In recent weeks data has had little bearing on stock price movement. In fact, the opposite has been the case. Whatever happens with stock and bond prices is selectively used to spin the data interpretation.
There are many dire warnings of recession and a complete market collapse. They are hard for most to ignore, especially since these are the grist for nightly news summaries.
I am not worried about these outcomes. Asking myself the best topic to write about this week, I decided a focus on my personal analysis should be more prominent than usual. Rather than relying only on my opinion, and those of some other savvy experts, I will look in more depth at the week’s trading. When I finish, we will be asking:
Are you ready for your holiday shopping?
If we get a little bounce in stocks, you will see the punditry, always followers, join in asking this question.
This week’s Investing section has some ideas for your list…
RGB Perspectives: A Correction In A Long-Term Bull
By: Rob Bernstein, RGB Capital Group
Published: 12.10.18
I continue to believe that the increased volatility we have seen over the last two months is a correction in a long-term bull market and not the start of a protracted bear market. The indicators that I watch continue to suggest that the economy is strong and corporate earnings are positive. The market appears to be reacting to every headline regarding trade talks with China and whether the Fed will continue to shift to a more accommodative stance. Positive news on either of these fronts will likely push the market higher.
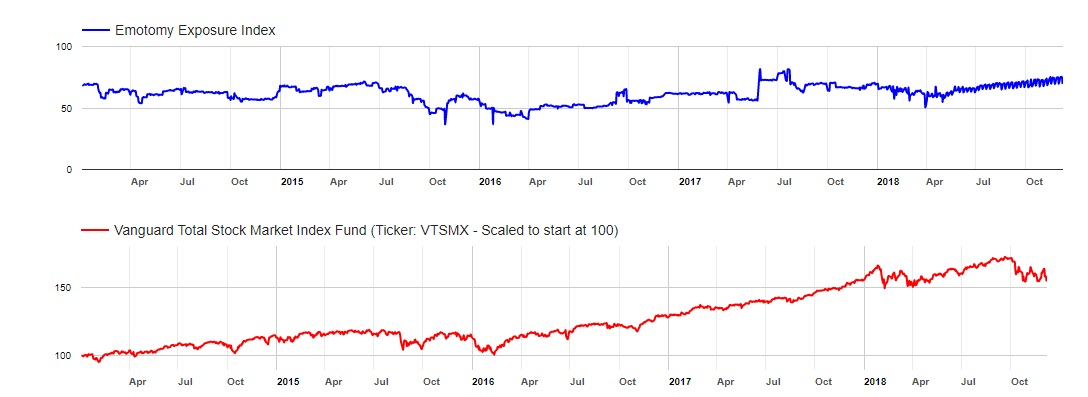
Weekly Update: The Emotomy Exposure Index
Published by: Emotomy.com
The Emotomy Exposure Index represents the average daily exposure to equity markets in the investment accounts of Emotomy’s clients. This Index provides insight into the actual adjustments investment advisers have made to client accounts over time.
Current Emotomy Exposure Index Reading: 69.6
Current Direction: Down
More on the Emotomy Exposure Index
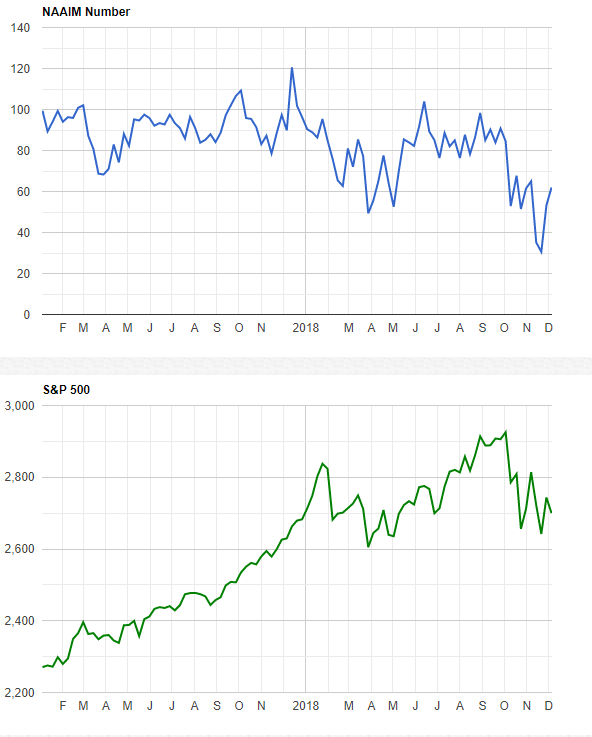
Weekly Update: The NAAIM Member Exposure Index
The NAAIM Exposure Index represents the average exposure to US Equity markets reported by our members.