


All Clear?
By: David Moenning, Heritage Capital Research
Published: 1.22.19

The bad news is that after a rather rambunctious rally, the S&P 500 remains -8.9% from its all-time high. The good news is that after the -19.8% shellacking that ended on Christmas Eve, the stock market now starts the week well above its December lows and looking good.
To be sure, the recent rally has been impressive. In the last 17 trading sessions, the venerable S&P 500 has gained an eye-popping +13.6%. In the last 17 days, the index has finished in the red just 4 times and save the second trading day of 2019, the damage done during those losing sessions has been minimal. In the last 17 days, the major indices have “exited corrections,” recouped their respective 50-day moving averages, and produced what are commonly referred to as “thrust” buy-signals. And in the last 17 days, the mood has turned from dismal to delight.
Suddenly, stocks don’t go down anymore – ever. The trend is up. Momentum is strong. And anyone looking to add to their long exposure has been frustrated by the fact that there just aren’t any “dips” to buy these days.
Thus, the major question on my mind as we start this holiday-shortened week is, are the bulls in the clear?
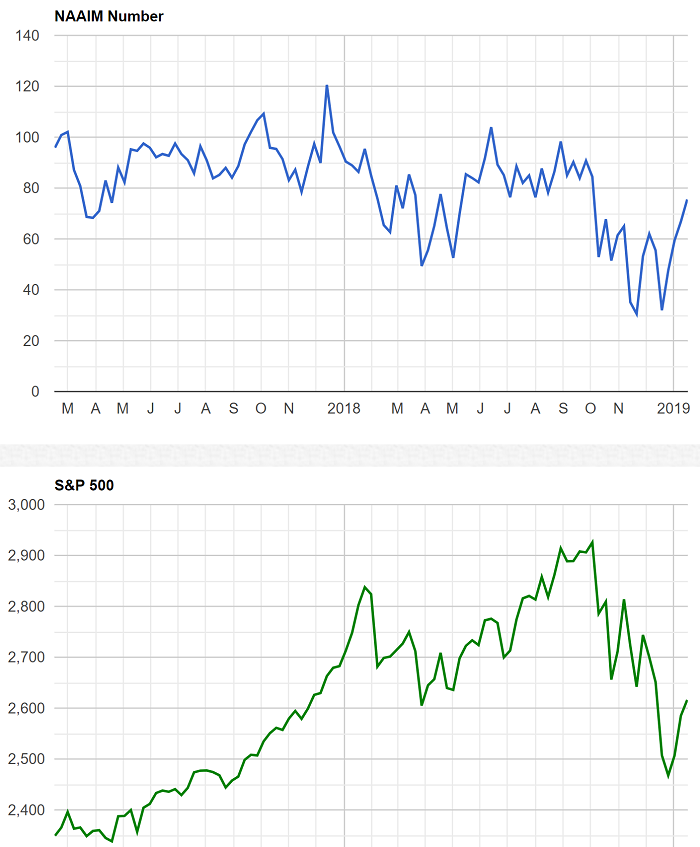
The Message From the NAAIM Indicator Wall: Not Enough Green
By: National Association of Active Investment Managers
Updated: 1.21.19
The NAAIM Indicator Wall provides a weekly update to a robust array of stock market indicators. The “wall” includes readings and explanations of indicators and/or models in the areas of price/trend, momentum, key price levels, overbought/sold readings, sentiment, monetary, economic, inflation, and market cycles.
This week, we’re featuring the Primary Cycle Indicator Board, which is a group of longer-term models designed to determine the overall “state of the market” and to identify which team has control of the game.
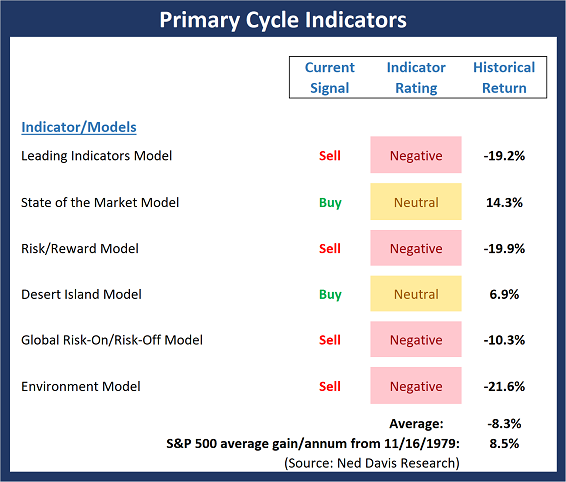
Once again, there is an important change on the Primary Cycle board this. Unfortunately, this week’s change is to the downside. While stocks are enjoying a robust rally, the Risk/Reward model slipped back into negative territory and flashed a sell signal. And although the rally is young, we would feel a lot more comfortable if a couple more of our favorite “state of the market” models would move to the buy side and if some of the modeal readings would turn green.
Note: The Indicator Wall is a benefit provided to NAAIM Members and is password protected. To obtain a temporary password, contact NAAIM at 888-261-0787.
“V” Bottom? Maybe. But A Pullback Is Due!
By: Paul Schatz, Heritage Capital LLC
Published: 1.21.19
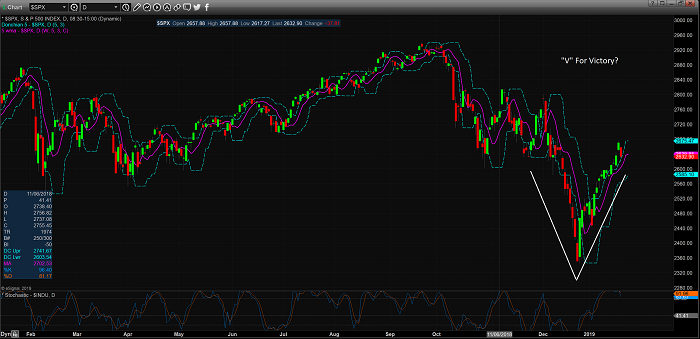
Stocks closed at their highest levels since December 6th on Friday, wiping out 100% of the vicious and relentless selling wave I wrote about for so long. So far, the bottom has had the shape of a “V” which is not only rare, but generally uncomfortable for me as “V” bottoms are more characteristic of bear market than bulls. To counter that, there have been numerous confirmations that the rally since the Christmas low is a blast off of a new bull market leg. While I am much more inclined to side with the latter, I am also not dumb enough nor arrogant enough to believe I know better than the market. As I always do, we will take it day by day and week by week and see what the market tells us.
Stocks have come very far, very fast as I keep hearing from the pundits in the media. Well folks, that depends on your time frame. While the stock market closed at its highest level since December 6 and has recovered 100% of the vicious and relentless selling wave from last month, it’s right back at the price levels where we saw lows in October, November and early December. In other words, stocks went straight down and straight up. I also think they are due for a pause or pullback right here and now….
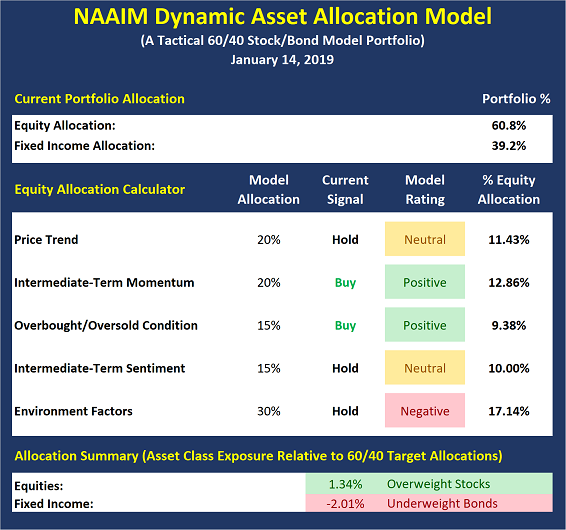
Update: The NAAIM Dynamic Allocation Model
Designed to be a value-add benefit to membership, NAAIM offers a Dynamic Asset Allocation Model based on the NAAIM Indicator Wall of indicators and models. The overall objective of the model portfolio is to dynamically adapt to changing market environments and to keep equity exposure in line with current conditions. The model targets a normalized allocation of 60% stocks and 40% Bonds.
Here is this week’s model allocation:
The model has been run live on the NAAIM website for several years and has demonstrated the ability to reduce exposure to market risk during negative environments such as those seen in 2015-16 and 2018.
COMING SOON: The model is currently shown within the NAAIM Indicator Wall but will soon be an option in the “Programs” Tab of the NAAIM.org website.
The NAAIM Dynamic Allocation Model is for illustrative and informational purposes only, and does not in any way represent an endorsement by NAAIM or an investment recommendation.
Dash of Insight: The Real-Time Economic Lesson Continues
By: Jeffrey Miller Dash of Insight
Published: 1.21.19
t is a light economic calendar in a holiday-shortened week. Political headlines and the government shutdown will dominate financial news. Earnings reports are more important for investors, so we should focus there. I also recommend several key themes. We should all be watching closely as… The Real-Time Economic Lesson Continues.
I hope we can analyze stocks instead of political controversies in the week ahead.
In my last edition of WTWA I asked whether earnings reports would change the gloomy “message” of the markets. That was the right question, and earnings seem generally in line with continuing modest economic growth.
John Butters (FactSet) reports on the earnings season so far, with 11% of the S&P 500 reporting. The earnings “beat rate” is 76% and the revenue beat rate is 56%. The growth rate is currently 10.6%. On the negative side is the movement in 2019 forecasts. Estimates for the first half of the year have declined 4.5%, more than the recent average decline of 2.4%. Here is a chart showing the movement in both estimates and price over the last few months.

Which is Better: Buy-and-Hope or Active Management?
By: Ben Reppond Reppond Investments
Published: 1.20.19
There are two schools of thought about investing – buy-and-hold investing and active management. Those in each camp believe strongly in their position. Let’s take a closer look.
BUY-AND-HOLD INVESTING
Buy-and-hold investing is a passive” investment style in which an investor buys equities and holds them for a long period of time, regardless of fluctuations in the market. It allows an investor (or investment manager) to strategically allocate assets in alignment with the investor’s investment goals and risk tolerance.
The buy-and-hold investment style has become very popular and proponents believe that it provides the best investor experience over time. In an ETF.com article, the writer states, “The fallacy of the active argument is obvious on the surface: There’s no way all active fund managers can beat the market, because added together, they are the market. In a vacuum, we would expect half of these managers to underperform the market and half to beat it.”
The problem is…
LYONS MARKET UPDATE – Of V’s and FOMO
By: Dexter P. Lyons Issachar Fund
Published: 1.22.19
On October 3rd, 2018, (I went to CASH) the Fed indicated that they were “a long way” from getting rates to neutral (indicating more rate increases on the way) and the S&P 500 Index dropped over 19% until bottoming on December 24th. Since Christmas Eve, the S&P 500 has formed a V-Bottom pattern and is up over 13% (only about 8% from the high) after the Fed indicated they may slow their rate increases. Judging from this V-Bottom, I would not be surprised to find out later that the Fed has halted its Quantitative Tightening (QT) and re-implemented some form of Quantitative Easing (QE) to appease Trump and the markets. V-bottoms were trademark (signature) patterns witnessed during the QE era, but we are now in QT mode, right? I believe that the market was expecting the Fed to plunge us into a recession with its rapid rate increase posture and now the market expects the Fed to “stand down” to not hinder the market’s advance. China just posted its slowest economic numbers since 1990, do you think the US will grow faster or slower now that China’s economy is struggling? Maybe the Fed got the message and this time is different?
RGB Perspectives: Keeping the Rally in Perspective
By: Rob Bernstein, RGB Capital Group
Published: 1.21.19
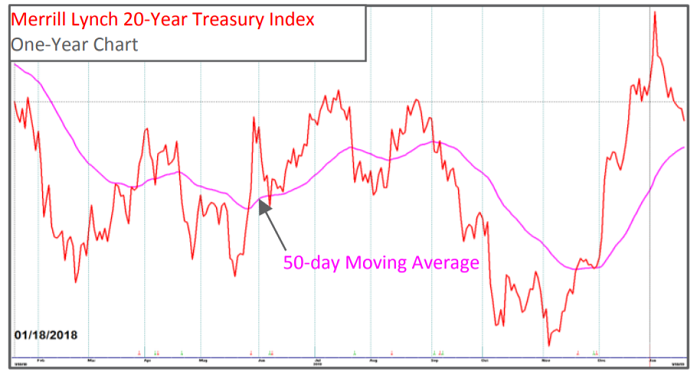
During uncertain times, investors flee to the safety of US Treasuries, as they did during the last part of 2018. When risk subsides, US Treasuries tend to decline as investors sell
Treasuries in favor of riskier assets. The current downtrend in US Treasuries supports the ‘risk on’ environment that we see on the charts shown.
While these charts reflect a healthy market environment, the market is overbought and due for some sort of pullback. The extent of that pull back will help us put this recent bounce into perspective…
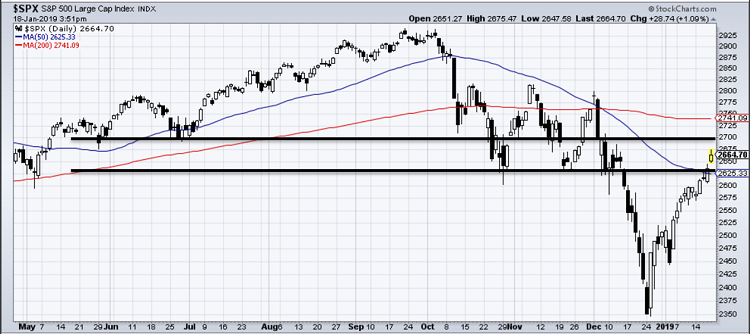
BAM Market Note: Time To Be Wary of the Move?
By: Sam and Bo Bills Bills Asset Management
Published: 1.18.19
With rumors of movements towards a tariff solution or at least a pause in the implementation, the markets have surged upward over the last two days. With today’s advance, the S&P is now up 10 of the last 12 trading days. With an annualized return over the last 12 days of over 600%, the pace of the advance will need to pause over the coming days. The resistance line we have been watching was pierced to the upside with today’s gains lending increased credence to the validity of the rally. The next level of resistance is just above current levels at 2700. With no pullbacks to speak of over the last two weeks, it will be very instructive when the next pullback comes. If such pullback holds above old resistance (now new support) at the 2630 area, then it would be further evidence that the rally is here to stay and a revisit to the late 2018 lows will have to wait awhile. However, investors should be wary of chasing this rally and instead wait for a pullback to determine the validity of the current advance and to get a better entry point…
Weekly Update: The NAAIM Member Exposure Index
The NAAIM Exposure Index represents the average exposure to US Equity markets reported by our members.