NAAIM Speaks is bi-monthly newsletter containing market insights and analysis from NAAIM member firms. “Speaks” is designed to provide a plethora of market analysis, indicators, some occasional humor, as well as a summary of NAAIM’s proprietary Dynamic Asset Allocation Model and Managers Exposure Index. The report is for informational uses only and is not to be construed as investment advice.
Modeling 2020 Expectations (Just For Fun)
By: David Moenning, Heritage Capital Research
Published: 1.13.20

I don’t know about you, but I’ve been intrigued lately by all the projections/prognostications that analysts feel compelled to provide at the beginning of each year. So, just for fun, I thought I’d join in the game this year.
To be clear, I do NOT manage money based on predictions, macro views, or the proverbial gut hunches. No, I prefer to stick to the weight of the evidence from a plethora of market models. I strive to keep portfolios positioned in line with what “is” happening in the market and not what I think “should” to be happening in the market. I learned a LONG time ago that Ms. Market doesn’t give a hoot about what I think “ought” to be happening in her game and that my primary job is to try and get it mostly right, most of the time.
However, I’m also known in the business as a bit of a model geek. So, I decided to try my hand at “modeling” the outlook for the S&P 500 this year. But as I hope I’ve made clear, this is a “just for fun” exercise.
An Opportunity For The Bears
By: Paul Schatz, Heritage Capital LLC
Published: 1.13.20

Since mid-November, I have often discussed sentiment in the stock market. Plainly put, investors have been very confident to the point of being greedy and giddy to an historic extreme. We last saw that behavior in January 2018 which led to a 13% stock market decline to resolve the condition. Of course, there were other factors that led to that decline, like some cracks in the market’s foundation, something I am not seeing today.
In fact, it’s really bullish out there. This makes a “trade” fairly easy to execute. For now, until and unless the various indices, sectors and stocks close above last Friday’s high, the short-term is neutral at best, negative at worst…
Is It Time To Worry About Inflation?
By: Jeffrey Miller Dash of Insight
Published: 1.11.20

Markets got a taste of the possible consequences from increased Middle East conflict latel. Much of the punditry was left amazed that the impact was not greater. Their business is discussing what to worry about, so they are wondering why their daily reports are not having a greater effect. My biggest worry is hardly mentioned – at least outside of the doomster network. For years I have said that inflation news was not relevant but would be someday. I have also cheered for modest inflation levels while others sought an increase to the Fed target of 2%….
NEW FEATURE: In Search of Opportunities!
By: Jacob Deschenes, ERA Capital Management
Published: 1.10.20
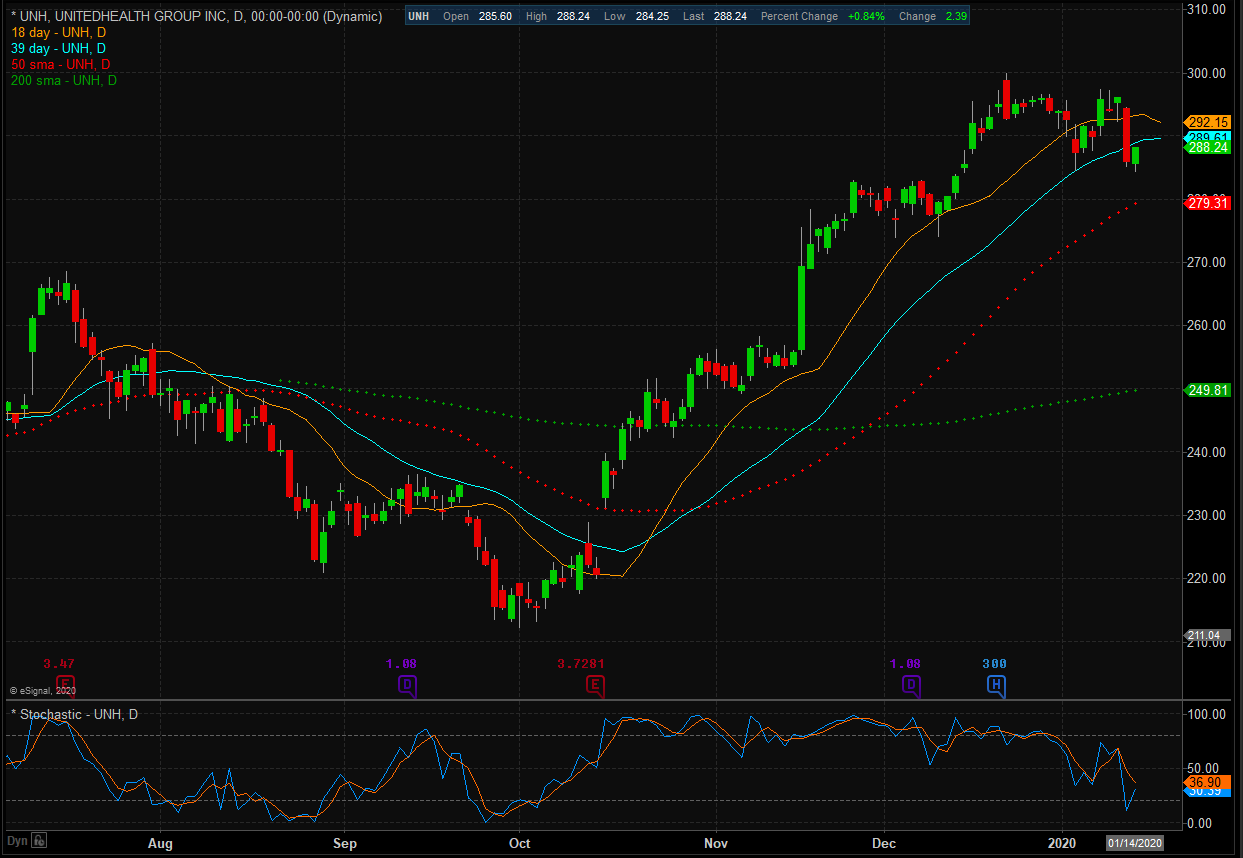
ERA Capital Management’s Jacob Deschenses seeks out opportunities in winning stocks that have experienced an extreme near-term event. This month, Jacob has suggests the opportunity in UnitedHealth Group has now passed and it’s time to take profits…
Contact Jacob to talk about how ERA is playing this position…
The Message From the NAAIM Indicator Wall: Are The Fundamentals Starting To Wobble?
By: National Association of Active Investment Managers
Updated: 1.13.20
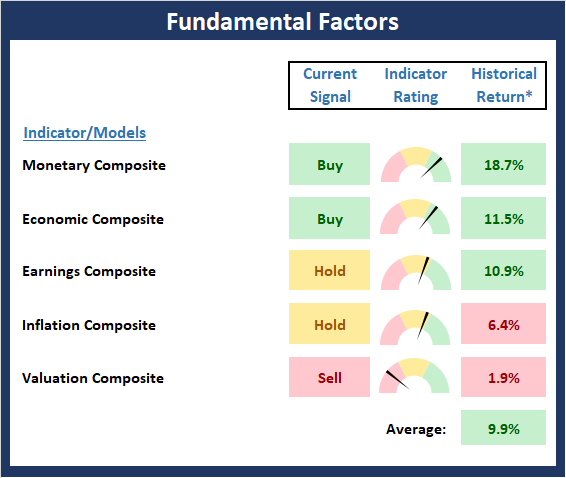
The NAAIM Indicator Wall provides a weekly update to a robust array of stock market indicators. The “wall” includes readings and explanations of indicators and/or models in the areas of price/trend, momentum, key price levels, overbought/sold readings, sentiment, monetary, economic, inflation, and market cycles.
This time, we’re featuring the Fundamental Board, which is designed to look at the market’s fundamental factors such as interest rates, the economy, inflation, and valuations.
Note: The Indicator Wall is a benefit provided to NAAIM Members and is password protected. To obtain a temporary password, contact NAAIM at 888-261-0787.
Mining the NAAIM Indicator Wall for Real World Applications
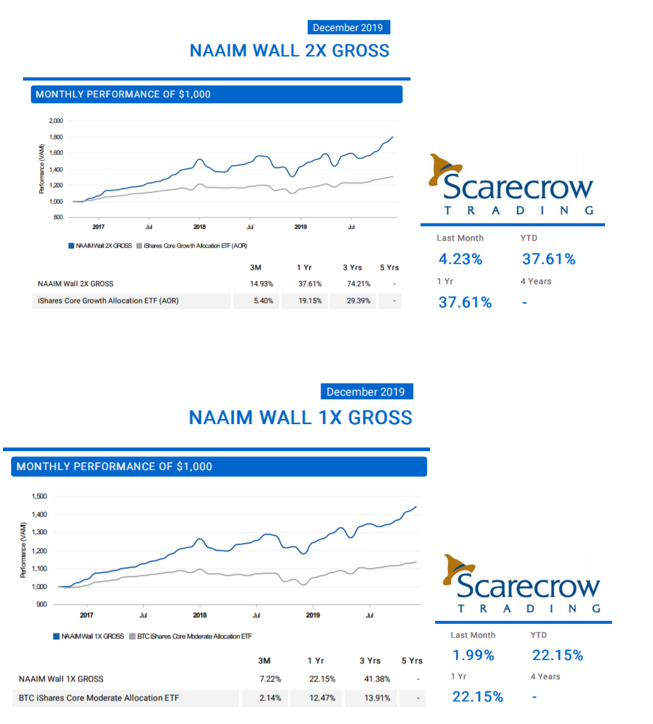
Len Fox at Scarecrow Trading, who is a two-time winner of the NAAIM Shark Tank Active Investing Strategy Competition developed a couple of portfolio strategies based on the NAAIM Indicator Wall. Below is an update of the two portfolios Scarecrow runs:
Feel free to contact Len or his team about the methodology used in these portfolios at (952) 250-7453.
All About The Fed
By: Rob Bernstein, RGB Capital Group
Published: 1.6.20

One of the reasons that I believe stocks and junk bonds are
trending up is the accommodative policies of the Federal
Reserve. One way the Federal Reserve provides liquidity to
the financial system is to buy assets (such as bonds) as they
did following the 2008 Financial Crisis, called quantitative
easing. While the Fed has indicated they are not currently
undertaking quantitative easing efforts, the chart of the
Federal Reserve – Total Assets tells a different story. The
Federal Reserve – Total Assets has increased from $3.8 trillion
to $4.2 trillion, or 11%, since September 1st…
The NAAIM Dynamic Allocation Model
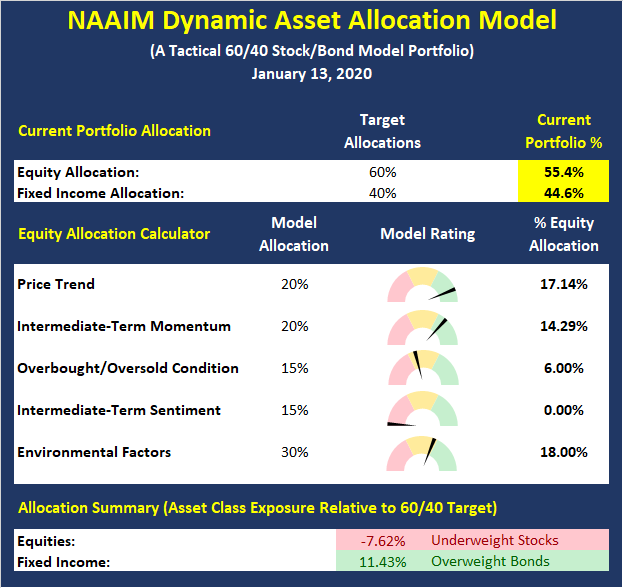
Designed to be a value-add benefit to membership, NAAIM offers a Dynamic Asset Allocation Model based on the NAAIM Indicator Wall of indicators and models. The overall objective of the model portfolio is to dynamically adapt to changing market environments and to keep equity exposure in line with conditions. The model targets a normalized allocation of 60% stocks and 40% Bonds.
Here is this week’s model allocation:
Of note this week is the Overbought/Oversold and Sentiment Indicators, which have reached extreme levels and caused the model to temporarily reduce exposure to equities.
The model has been run live on the NAAIM website for several years and has demonstrated the ability to reduce exposure to market risk during negative environments such as those seen in 2015-16 and 2018.
More on the Dynamic Allocation Model and Historical Readings
The NAAIM Dynamic Allocation Model is for illustrative and informational purposes only, and does not in any way represent an endorsement by NAAIM or an investment recommendation.
Tensions in the Middle East? Never Mind.
By: Sam and Bo Bills Bills Asset Management
Published: 1.10.20

The market’s continued strength, durability and ambivalence to negative headlines is impressive. Despite the media reports of an impending World War III and a reinstatement of the draft, Wall Street looked through the over-reaction and took things as they came. That is not to say that things can’t heat back up in the Middle East, but, for now, cooler heads have prevailed. The US economy remains on solid footing. We will get a good idea of how solid in the next week or two…
Important Divergences
By: Craig Thompson, President Asset Solutions
Published: 1.6.20
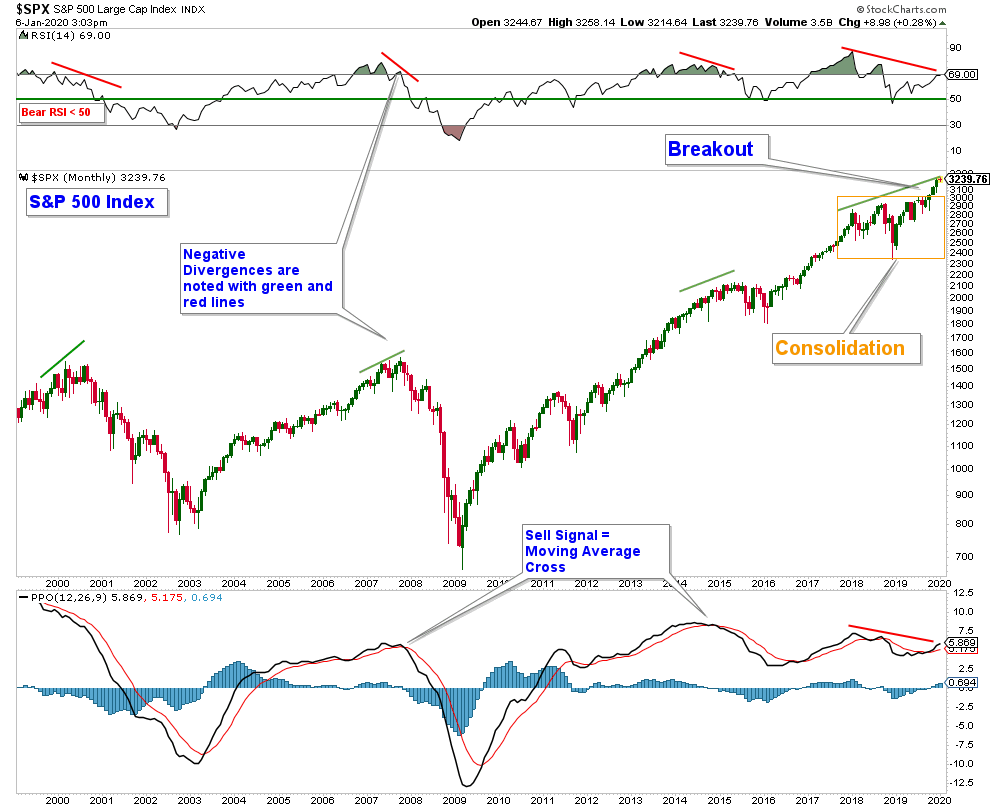
In the past 20 years, I believe there have been at least 3 very important negative divergences. All three of the past negative divergences that I have noted below have ultimately resulted in a major correction in the stock market. As with any negative divergence, it should always be viewed as a warning sign, not a signal. These divergences can last for a long time and also can get negated by a strong advance in the index that would negate the divergence. That being said, long-term momentum is suggesting an elevated level of risk…
No One Goes Broke Taking Profits!
By: Dexter P. Lyons Issachar Fund
Published: 1.13.20

I reduced exposure last week to lock in profits as I believe the market appears ready for a pull-back. No one that I know has ever gone broke taking profits. I added a 30% technology index short as I believe stocks look a little extended and could be subject to some profit taking so this short is designed to potentially minimize volatility. The market is heading into earnings season and I do not like to hold stocks through earnings, so the earliest reporting stocks were the first to be sold. I have learned that the risk of holding stocks through “earnings” is a little too “rich for my blood,” so I prefer to sell and not take that chance. I am still bullish into the November election, but I do not expect the market to advance in a straight line so “wiggles” are expected”…
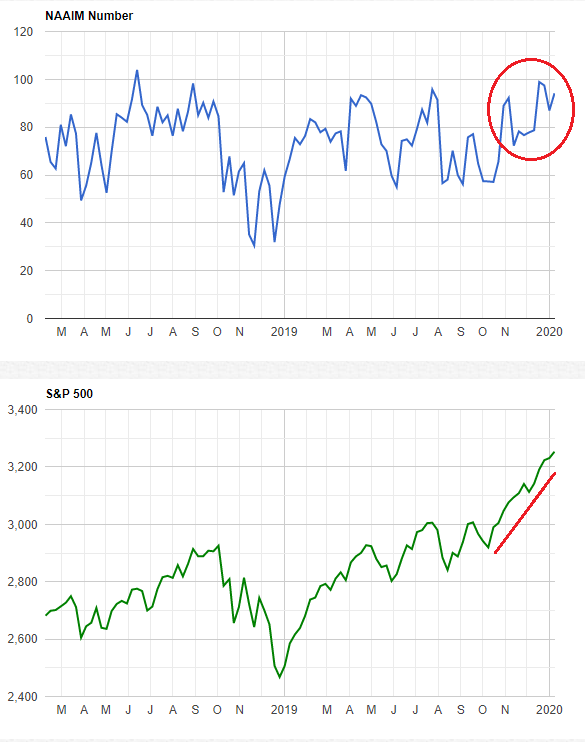
The NAAIM Member Exposure Index: Managers Riding The Bull Train
The NAAIM Exposure Index represents the average exposure to US Equity markets as reported by our members in the organization’s weekly survey. Note that many NAAIM members are risk managers and tend to reduce exposure to the markets during high risk environments.
The last week’s exposure reading is 94.16.
More on the NAAIM Exposure Index
NOT INVESTMENT ADVICE. The analysis and information in this report and on our website is for informational purposes only. No part of the material presented in this report or on our websites is intended as an investment recommendation or investment advice. Neither the information nor any opinion expressed nor any Portfolio constitutes a solicitation to purchase or sell securities or any investment program. The opinions and forecasts expressed are those of the editors and may not actually come to pass. The opinions and viewpoints regarding the future of the markets should not be construed as recommendations of any specific security nor specific investment advice. Investors should always consult an investment professional before making any investment.
Tags: NAAIM, NAAIM Speaks, Stocks market analysis, Stock Market Analysis, Stock market, stock market indicators, David Moenning, Paul Schatz, Jeffrey Miller, Rob Bernstein, Sam Bills, Bo Bills, Dexter Lyons, Jacob Deschenes, NAAIM Exposure Index, NAAIM Dynamic Allocation Model, Len Fox


