


NAAIM Speaks is monthly newsletter containing market insights and analysis from NAAIM member firms. This newsletter is designed to provide a plethora of market analysis, indicators, some occasional humor, as well as a summary of NAAIM’s proprietary Dynamic Asset Allocation Model and Managers Exposure Index. The report is for informational uses only and is not to be construed as investment advice.
Sell In May And Go Away?
By: David Moenning, Heritage Capital Research
Published: 5.2.23

Don’t look now fans, but the “Sell in May” season is upon us. You likely know that the May through October period is historically weak. But our handy, dandy cycle composite work says this is NOT the year to heed the old Wall Street saw. In fact, history suggests….
The Fed Clueless If They…
By: Paul Schatz, Heritage Capital LLC
Published: 5.3.23

Here we go. Another one of those “most important Fed meetings ever” nonsense from the media. “SPECIAL Coverage”. Oh boy. I couldn’t sleep with all that anticipation. From my seat, the Fed is clueless if they…
Long-Term Indicator Change
By: Ryan C. Redfern ShadowRidge Asset Management
Published: 4.28.23

There are important changes to our both our Shadowridge Long-Term Trend indicator as well as our Mid-Term Cycle Signal, which suggests we should…
The Message From the NAAIM Indicator Wall
By: National Association of Active Investment Managers
The NAAIM Indicator Wall provides a weekly update to a robust array of stock market indicators. The “wall” includes readings and explanations of indicators and/or models in the areas of price/trend, momentum, key price levels, overbought/sold readings, sentiment, monetary, economic, inflation, and market cycles.
This time, we’re featuring the Primary Cycle Board , which is designed to identify the primary trend of the overall “state of the stock market.”

Note: The Indicator Wall is a benefit provided to NAAIM Members and is password protected. To obtain a temporary password, contact NAAIM at 888-261-0787.
The Line In The Sand
By: Rob Bernstein, RGB Capital Group
Published: 5.1.23

Stocks and bonds are bouncing around near critical breakout levels and this week we will receive additional data on the
overall health of the economy including the Services and Non-Manufacturing PMI, the Fed rate decision and April payroll
numbers. These will all provide additional clues to the state of the economy and what we might expect in the future…
Not As Strong As It Looks
By: Craig Thompson, President Asset Solutions
Published: 5.1.23

The Fed is raising rates in hopes of taming inflation by reducing demand. When the Fed eventually reverses course and begins to lower rates, it will be accompanied by a weak economy (probably a recession). Historically, the stock market doesn’t bottom until the Fed is near the end of its easing cycle and the recession is in its later innings. This suggests that the ultimate bottom in the stock market is many months away…
The NAAIM Dynamic Allocation Model
Designed to be a value-add benefit to membership, NAAIM offers a Dynamic Asset Allocation Model based on the NAAIM Indicator Wall of indicators and models. The overall objective of the model portfolio is to dynamically adapt to changing market environments and to keep equity exposure in line with conditions. The model targets a normalized allocation of 60% stocks and 40% Bonds.
Here is this week’s model allocation:
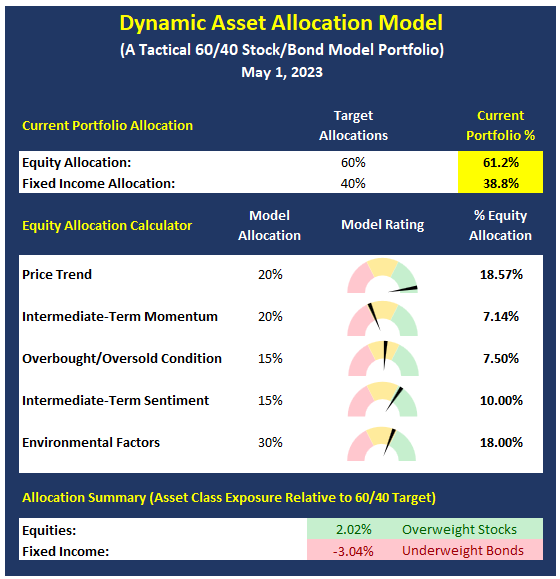
The model has been run live on the NAAIM website for several years and has demonstrated the ability to reduce exposure to market risk during negative environments such as those seen in 2015-16 and 2018.
More on the Dynamic Allocation Model and Historical Readings
The NAAIM Dynamic Allocation Model is for illustrative and informational purposes only, and does not in any way represent an endorsement by NAAIM or an investment recommendation.
Are The Bears Back in Business?
By: Sam and Bo Bills Bills Asset Management
Published: 4.28.23

The stock market started the week decidedly negative as First Republic Bank released earnings on Monday afternoon and revealed a 40% decline in deposits. The sharp decline added fuel to the argument that the regional bank turmoil may not be over. The news spooked an already anxious market and bears stepped in to take control of the early week market action…
Now What?
By: Dexter P. Lyons Issachar Fund
Published: 5.1.23

The S&P 500 Index has rallied into its February high line of resistance off the backs of heavily weighted (the Generals) mega-cap names (AAPL, MSFT, NVDA & META). Now what?
The NAAIM Member Exposure Index
The NAAIM Exposure Index represents the average exposure to US Equity markets as reported by our members in the organization’s weekly survey. Note that many NAAIM members are risk managers and tend to reduce exposure to the markets during high risk environments.
Click To See the Current Exposure Index
NOT INVESTMENT ADVICE. The analysis and information in this report and on our website is for informational purposes only. No part of the material presented in this report or on our websites is intended as an investment recommendation or investment advice. Neither the information nor any opinion expressed nor any Portfolio constitutes a solicitation to purchase or sell securities or any investment program. The opinions and forecasts expressed are those of the editors and may not actually come to pass. The opinions and viewpoints regarding the future of the markets should not be construed as recommendations of any specific security nor specific investment advice. Investors should always consult an investment professional before making any investment.
Tags: NAAIM, NAAIM Speaks, Stocks market analysis, Stock Market Analysis, Stock market, stock market indicators, David Moenning, Paul Schatz, Rob Bernstein, Ryan Redfern, Sam Bills, Bo Bills, Dexter Lyons, Craig Thompson, NAAIM Exposure Index, NAAIM Dynamic Allocation Model


