


NAAIM Speaks is monthly newsletter containing market insights and analysis from NAAIM member firms. This newsletter is designed to provide a plethora of market analysis, indicators, some occasional humor, as well as a summary of NAAIM’s proprietary Dynamic Asset Allocation Model and Managers Exposure Index. The report is for informational uses only and is not to be construed as investment advice.
Bostic Boost
By: David Moenning, Heritage Capital Research
Published: 3.6.23

During the month of February, the path of least resistance for both stock and bond prices appeared to be down. Given the macro narrative, this actually made some sense. After all, with the inflation and economic data coming in hotter/better than expected and the Fed pledging to remain “data dependent,” markets had been busy pricing in the necessary adjustments. But a funny thing happened on the way to the market debacle….
Hating, Disavowing and Fighting the Rally
By: Paul Schatz, Heritage Capital LLC
Published: 3.6.23

I wrote recently about the bulls battling back precisely at the time when the bears were about the declare victory. The same thing happened in December as well as last October. While the masses are all disavowing, hating and fighting the rally, it has been a decent run nonetheless, just not the usual blastoff from a bear market bottom. And that’s okay. There remain headwinds…
More Upside Ahead?
By: Ryan C. Redfern ShadowRidge Asset Management
Published: 2.24.23

There are a couple of ratios that we follow that suggest we could see more up-side in the next few months. Both the Growth to Value stock ratio and the NASDAQ to S&P500 ratios are leaning towards Growth and NASDAQ. Beyond the ratios, Seasonality is worth keeping in mind when thinking about how to invest. This month’s chart will go into more detail, but so far this year, January and February have played out as expected and the next few months are seasonally strong.
The Message From the NAAIM Indicator Wall
By: National Association of Active Investment Managers
The NAAIM Indicator Wall provides a weekly update to a robust array of stock market indicators. The “wall” includes readings and explanations of indicators and/or models in the areas of price/trend, momentum, key price levels, overbought/sold readings, sentiment, monetary, economic, inflation, and market cycles.
This time, we’re featuring the Primary Cycle Indicator Board , which is designed to identify the primary trend of the overall “state of the stock market.”

Note: The Indicator Wall is a benefit provided to NAAIM Members and is password protected. To obtain a temporary password, contact NAAIM at 888-261-0787.
All About the Fed
By: Rob Bernstein, RGB Capital Group
Published: 3.6.23

Investors remain focused on the Federal Reserve and their ability to tame inflation without pushing the economy into a
severe recession. It is widely expected that the FOMC will raise rates 0.25% at its next three meetings (March, May and
June). Any deviation from that would likely create additional market volatility. Fed Chairman Jerome Powell will share his
outlook on the economy this week and the February payroll numbers are due to be released on Friday. Another strong jobs
report could…
Staying Bullish
By: Craig Thompson, President Asset Solutions
Published: 3.5.23

The stock market is still bullish despite February’s pullback. What I wrote in last month’s newsletter still applies: “the market is displaying strength that we have not seen in over a year.” Here is a rundown of the positive developments that have occurred recently…
The NAAIM Dynamic Allocation Model
Designed to be a value-add benefit to membership, NAAIM offers a Dynamic Asset Allocation Model based on the NAAIM Indicator Wall of indicators and models. The overall objective of the model portfolio is to dynamically adapt to changing market environments and to keep equity exposure in line with conditions. The model targets a normalized allocation of 60% stocks and 40% Bonds.
Here is this week’s model allocation:
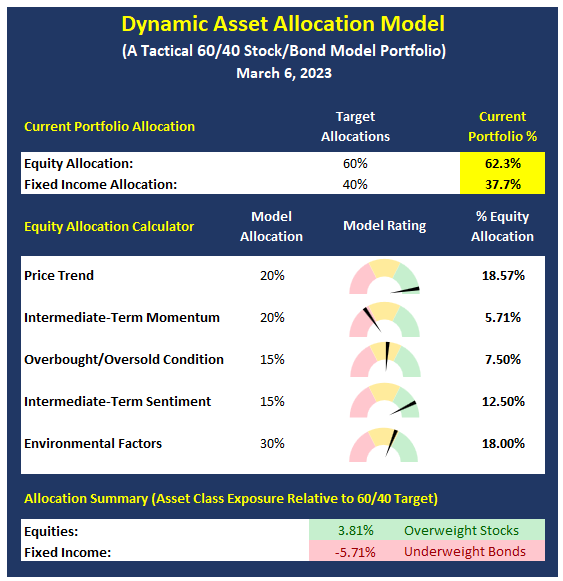
The model has been run live on the NAAIM website for several years and has demonstrated the ability to reduce exposure to market risk during negative environments such as those seen in 2015-16 and 2018.
More on the Dynamic Allocation Model and Historical Readings
The NAAIM Dynamic Allocation Model is for illustrative and informational purposes only, and does not in any way represent an endorsement by NAAIM or an investment recommendation.
Watching The 200-Day
By: Sam and Bo Bills Bills Asset Management
Published: 3.3.23

For many traders, moving averages play a big part in their trading decisions. Accordingly, breaches (one way or another), in these lines can lead to big moves in either direction. The 200-day moving average is one of the mostly widely watched and significant ones. The S&P’s recent brush with the closely watched line is something to pay attention to as many program trading
algorithms will be triggered on the penetration of this line and would lead to heavy selling pressures…
Ready to Roll!
By: Dexter P. Lyons Issachar Fund
Published: 3.6.23

The market seems to have worked out an oversold condition and may be ready to roll higher. Fed President Bostic said he thinks they can keep interest rate hikes to 25bps versus the 50bps hikes the market anticipated, and the market rallied Thursday and Friday. The S&P 500 tested and held support three times last week at its 200-DMA on above-average volume, signaling institutions actively supported this critical long-term average. The market also held support at its October up-trend line converging near the 200-DMA, so this was a significant level of support that held. The averages are in “rally mode,” and many individual stock leaders are breaking out on big volume…
The NAAIM Member Exposure Index
The NAAIM Exposure Index represents the average exposure to US Equity markets as reported by our members in the organization’s weekly survey. Note that many NAAIM members are risk managers and tend to reduce exposure to the markets during high risk environments.
Click To See the Current Exposure Index
NOT INVESTMENT ADVICE. The analysis and information in this report and on our website is for informational purposes only. No part of the material presented in this report or on our websites is intended as an investment recommendation or investment advice. Neither the information nor any opinion expressed nor any Portfolio constitutes a solicitation to purchase or sell securities or any investment program. The opinions and forecasts expressed are those of the editors and may not actually come to pass. The opinions and viewpoints regarding the future of the markets should not be construed as recommendations of any specific security nor specific investment advice. Investors should always consult an investment professional before making any investment.
Tags: NAAIM, NAAIM Speaks, Stocks market analysis, Stock Market Analysis, Stock market, stock market indicators, David Moenning, Paul Schatz, Rob Bernstein, Ryan Redfern, Sam Bills, Bo Bills, Dexter Lyons, Craig Thompson, NAAIM Exposure Index, NAAIM Dynamic Allocation Model


