


NAAIM Speaks is monthly newsletter containing market insights and analysis from NAAIM member firms. This newsletter is designed to provide a plethora of market analysis, indicators, some occasional humor, as well as a summary of NAAIM’s proprietary Dynamic Asset Allocation Model and Managers Exposure Index. The report is for informational uses only and is not to be construed as investment advice.
Blame It On Putin?
By: David Moenning, Heritage Capital Research
Published: 03.07.22

It would be easy blame the recent volatile (or, shall I say, violent) price action in both the stock and bond markets on Putin’s war. But it is important to recognize that there is more (as in, a lot more) going on here than just the war…
Seeds of an Oil Peak
By: Paul Schatz, Heritage Capital LLC
Published: 03.09.22
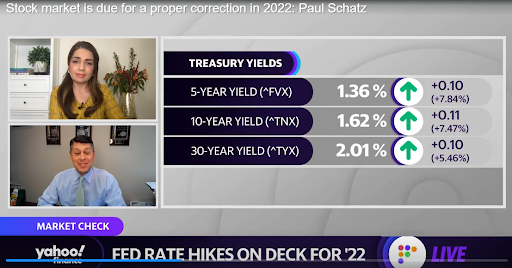
In Monday’s long video I spoke about energy and the likelihood of the commodity suddenly peaking. It could be now or next week or next month, but the price action and sentiment indicated end of move behavior rather than anything else…
Nowhere to Hide, Except…
By: Ryan C. Redfern ShadowRidge Asset Management
Published: 02.24.22

What is also making this market particularly difficult for traditional investors is that there aren’t many “safe” places to hide (more in the chart below). Luckily, we are not stuck in traditional thinking. We got signals to get out before the worst of the market drop occurred and went to largely cash and money market funds to weather the storm…
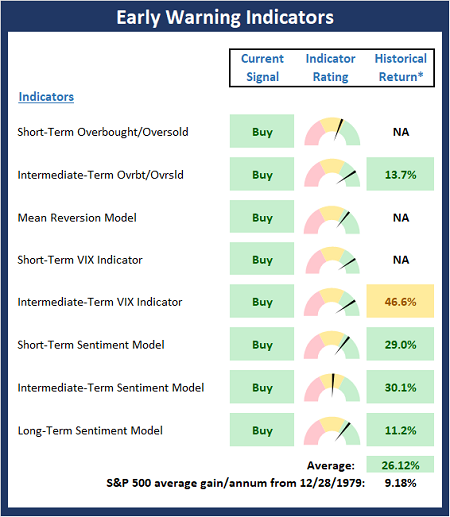
The Message From the NAAIM Indicator Wall
By: National Association of Active Investment Managers
Updated: 03.07.22
The NAAIM Indicator Wall provides a weekly update to a robust array of stock market indicators. The “wall” includes readings and explanations of indicators and/or models in the areas of price/trend, momentum, key price levels, overbought/sold readings, sentiment, monetary, economic, inflation, and market cycles.
This time, we’re featuring the Early Indicator Board , which is designed to suggest when the table is set for the trend to “go the other way.” Note this board did a nice job warning of both the most recent correction and the ensuing bounce.
Note: The Indicator Wall is a benefit provided to NAAIM Members and is password protected. To obtain a temporary password, contact NAAIM at 888-261-0787.
Stocks Hate Uncertainty
By: Rob Bernstein, RGB Capital Group
Published: 03.07.20

The financial impact of the Russian invasion of Ukraine is creating uncertainty for the financial markets and the stock market
does not like uncertainty. The surge in commodity prices, including oil, gas, and wheat, will have an economic impact in
Europe and around the globe…
The Early Stages of a Bear Market?
By: Craig Thompson, President Asset Solutions
Published: 03.08.22

The current correction in equity markets began in Q1 – Q2 of last year despite major market indexes not breaking down until the beginning of this year. This correction can be seen in the progressive deterioration in market breadth that I have shown in numerous past updates.Now that major market indexes are breaking down, what are market technicals suggesting about near and long-term market strength or weakness?
The NAAIM Dynamic Allocation Model
Designed to be a value-add benefit to membership, NAAIM offers a Dynamic Asset Allocation Model based on the NAAIM Indicator Wall of indicators and models. The overall objective of the model portfolio is to dynamically adapt to changing market environments and to keep equity exposure in line with conditions. The model targets a normalized allocation of 60% stocks and 40% Bonds.
Here is this week’s model allocation:
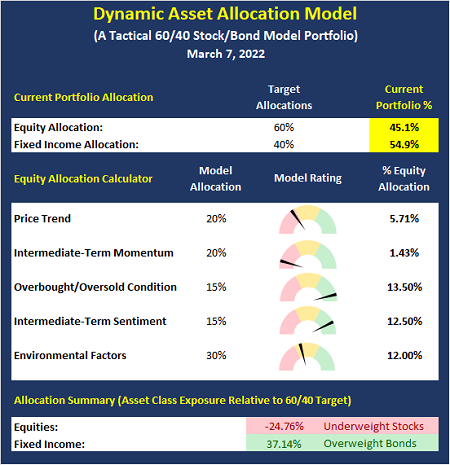
The model has been run live on the NAAIM website for several years and has demonstrated the ability to reduce exposure to market risk during negative environments such as those seen in 2015-16 and 2018.
More on the Dynamic Allocation Model and Historical Readings
The NAAIM Dynamic Allocation Model is for illustrative and informational purposes only, and does not in any way represent an endorsement by NAAIM or an investment recommendation.
Headlines Rule The Day
By: Sam and Bo Bills Bills Asset Management
Published: 03.04.22

News out of Ukraine continues to drive the market. But longer term, the issues that were facing our economy before Russia’s invasion remain…
Has Stagflation Arrived?
By: Dexter P. Lyons Issachar Fund
Published: 03.07.22

While the major indexes trade in correction (-10%) territory, there seems to be a bull market in the energy and commodity space. The world is seemingly turning on Russia due to their invasion of Ukraine as Putin gets “canceled.” Commodities like oil, wheat, and corn have soared to record levels, and that will likely result in more inflation and slower growth, called stagflation here in the US…
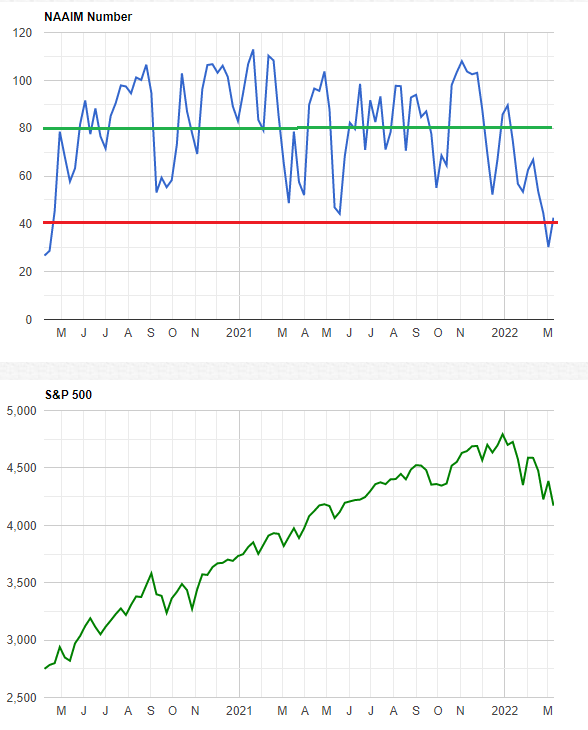
The NAAIM Member Exposure Index
The NAAIM Exposure Index represents the average exposure to US Equity markets as reported by our members in the organization’s weekly survey. Note that many NAAIM members are risk managers and tend to reduce exposure to the markets during high risk environments.
NOT INVESTMENT ADVICE. The analysis and information in this report and on our website is for informational purposes only. No part of the material presented in this report or on our websites is intended as an investment recommendation or investment advice. Neither the information nor any opinion expressed nor any Portfolio constitutes a solicitation to purchase or sell securities or any investment program. The opinions and forecasts expressed are those of the editors and may not actually come to pass. The opinions and viewpoints regarding the future of the markets should not be construed as recommendations of any specific security nor specific investment advice. Investors should always consult an investment professional before making any investment.
Tags: NAAIM, NAAIM Speaks, Stocks market analysis, Stock Market Analysis, Stock market, stock market indicators, David Moenning, Paul Schatz, Rob Bernstein, Ryan Redfern, Sam Bills, Bo Bills, Dexter Lyons, Craig Thompson, NAAIM Exposure Index, NAAIM Dynamic Allocation Model


