


NAAIM Speaks is bi-monthly newsletter containing market insights and analysis from NAAIM member firms. “Speaks” is designed to provide a plethora of market analysis, indicators, some occasional humor, as well as a summary of NAAIM’s proprietary Dynamic Asset Allocation Model and Managers Exposure Index. The report is for informational uses only and is not to be construed as investment advice.
Lots of Ammo for the Bears
By: Paul Schatz, Heritage Capital LLC
Published: 7.23.19

Lots of focus on technology this week as some of the behemoths report earnings. One thing is certain; there will be movement. All of the major stock market indices ended last week on the defensive as the bears put the plow down with a very heavy selling wave last Friday afternoon. That resulted in hundreds of stocks closing lower from all-time or recent highs which a yet another sign of a tired market. Coupled with overly confident options traders and very bullish sentiment surveys, the consolidation/pullback continues.
I find it really interesting here that there are certainly enough things to warrant a deep pullback but price, the final arbiter, has held up remarkably well…
Is There Any Upside From Here?
By: David Moenning, Heritage Capital Research
Published: 7.22.19

Let’s review. The S&P 500 is just 5 days removed from its most recent all-time high. Central bankers around the globe are either cutting rates or getting ready to cut rates. Economic growth is slowing. Earnings in the U.S. continue to beat estimates (although the bar for the current season appears to be sitting on the ground). Inflation is nowhere to be found. And the trade war between the U.S. and China looks like it is destined to drag on (at least until election season heats up next year).
Our furry friends in the bear camp argue that the trade war will drag the global economy into recession – and the U.S. along with it. On the other side of the aisle, our heroes in horns pulling the bull bandwagon tell us to never, ever “fight the Fed” and that everything will be fine.
Personally, I can get on board with the bulls’ argument here. But,the question of the day is, can stocks go any higher from here without any of the bull camp’s hopes/dreams coming true? Let’s look at some numbers…
The Message From the NAAIM Indicator Wall: Momentum Isn’t As Robust As You’d Expect
By: National Association of Active Investment Managers
Updated: 7.17.19
The NAAIM Indicator Wall provides a weekly update to a robust array of stock market indicators. The “wall” includes readings and explanations of indicators and/or models in the areas of price/trend, momentum, key price levels, overbought/sold readings, sentiment, monetary, economic, inflation, and market cycles.
This week, we’re featuring the Market Momentum Indicator Board, which is designed to indicate if there is any “oomph” behind the stock market’s current trend.
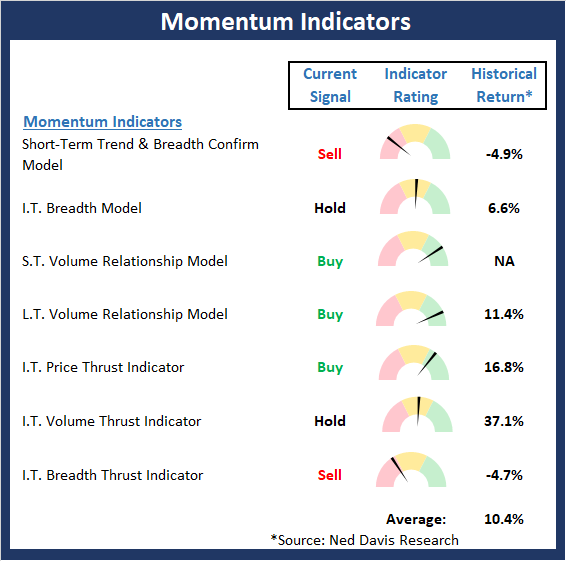
So far at least, the current pullback is following the script as we had been looking for a short/shallow corrective phase to begin. Watching the Momentum board will be important going forward. While there has been some weakening, the overall “state” of the board remains constructive. However, the readings on the Momentum board are not as strong as we’d like to see at this stage of the game…
Note: The Indicator Wall is a benefit provided to NAAIM Members and is password protected. To obtain a temporary password, contact NAAIM at 888-261-0787.
Models Gone Wild
By: Jeffrey Miller Dash of Insight
Published: 7.23.19

Of course we are talking about trading models. One of the big advantages of trading models is objectivity; they lack the emotional distractions that cause many humans to make mistakes.And of course there are many different metrics upon which you can build a model. For example, some of the popular Russell indexes/benchmarks are just very basic models based on market capitalization and valuation metrics such as book value to price ratios.
Models can get much more complex, including machine learning, for example, as described here: Tools for Machine Learning Development by Jenn Webb at The Practical Quant. There are also numerous examples of how NOT to build a model…
A Pullback Is To Be Expected, So…
By: Rob Bernstein, RGB Capital Group
Published: 7.22.19
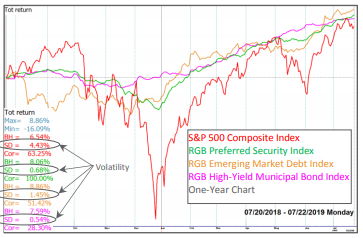
The S&P 500 Composite Index has pulled back from its all-time high reached a week ago. This widely followed large-cap stock index remains approximately 1% away from that point. A small pull back after such a strong advance off the May low is to be expected.
Yet, even in the current environment, there are plenty of good risk adjusted return opportunities…
Update: The NAAIM Dynamic Allocation Model
Designed to be a value-add benefit to membership, NAAIM offers a Dynamic Asset Allocation Model based on the NAAIM Indicator Wall of indicators and models. The overall objective of the model portfolio is to dynamically adapt to changing market environments and to keep equity exposure in line with current conditions. The model targets a normalized allocation of 60% stocks and 40% Bonds.
Here is this week’s model allocation:
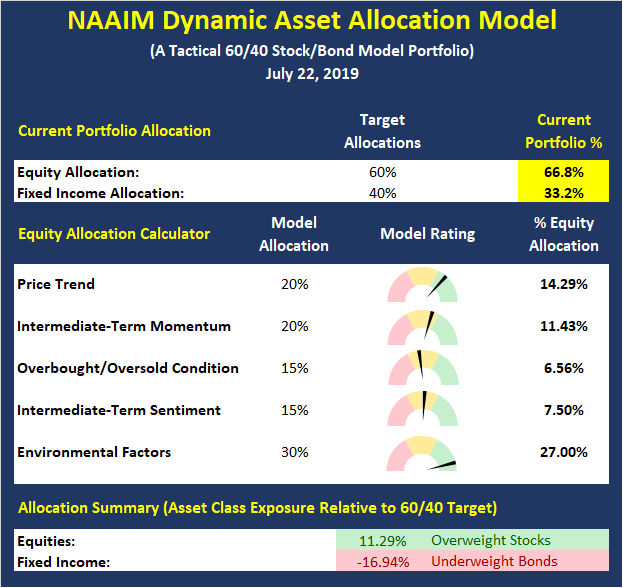
The model has been run live on the NAAIM website for several years and has demonstrated the ability to reduce exposure to market risk during negative environments such as those seen in 2015-16 and 2018.
More on the Dynamic Allocation Model and Historical Readings
The NAAIM Dynamic Allocation Model is for illustrative and informational purposes only, and does not in any way represent an endorsement by NAAIM or an investment recommendation.
Buyer Beware, Expectations Are High!
By: Sam and Bo Bills Bills Asset Management
Published: 7.19.19

Daily rumors and Fedspeak continue to create daily volatility. This morning the Fed Futures indicated a nearly 50% chance of a 50 basis point cut (the other 50% indicated a 25 basis point cut). However, by this afternoon Fed Futures had shifted to 75% for a small cut and 25% for a larger one. Regardless, the market is fully expecting a rate cut at the end of the month. Anything less and we are likely to see a big decline (the market does not like to be surprised!).
We believe it is very possible that the market sells off at the end of the month regardless of what the Fed does. Expectations are high and the Fed is unlikely to surpass them, so a buy the rumor sell the news mindset may be forthcoming.
The NAAIM Member Exposure Index: Managers Keeping Some Powder Dry
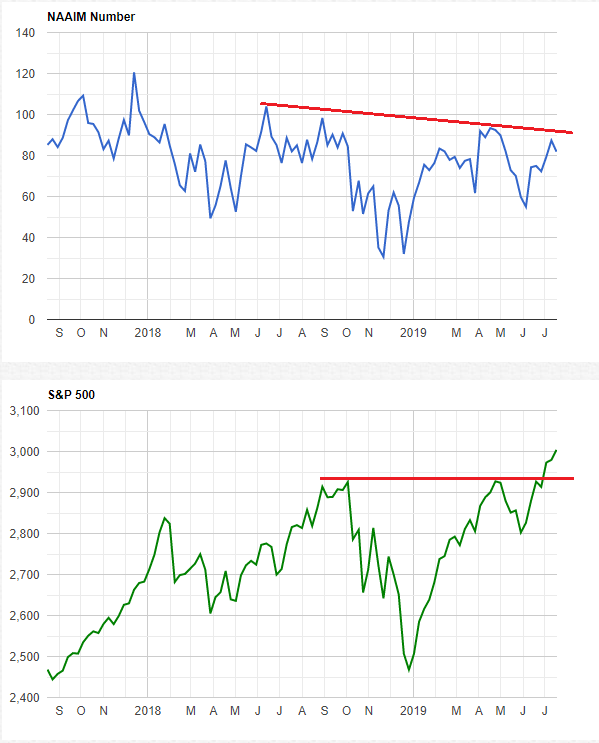
The NAAIM Exposure Index represents the average exposure to US Equity markets as reported by our members in the organization’s weekly survey. Note that many NAAIM members are risk managers and tend to reduce exposure to the markets during high risk environments.
Below is last week’s exposure reading. We note that the current exposure level among NAAIM members (82%) is below where it was in April, last summer, and late 2017. Thus, it looks like active risk managers prefer to keep some powder dry in light of slowing economic growth, the earnings pullback, and an ongoing trade war…
More on the NAAIM Exposure Index
NOT INVESTMENT ADVICE. The analysis and information in this report and on our website is for informational purposes only. No part of the material presented in this report or on our websites is intended as an investment recommendation or investment advice. Neither the information nor any opinion expressed nor any Portfolio constitutes a solicitation to purchase or sell securities or any investment program. The opinions and forecasts expressed are those of the editors and may not actually come to pass. The opinions and viewpoints regarding the future of the markets should not be construed as recommendations of any specific security nor specific investment advice. Investors should always consult an investment professional before making any investment.
Tags: NAAIM, NAAIM Speaks, Stocks market analysis, Stock Market Analysis, Stock market, stock market indicators, David Moenning, Paul Schatz, Jeffrey Miller, Rob Bernstein, Sam Bills, Bo Bills, NAAIM Exposure Index, NAAIM Dynamic Allocation Model


