


NAAIM Speaks is monthly newsletter containing market insights and analysis from NAAIM member firms. This newsletter is designed to provide a plethora of market analysis, indicators, some occasional humor, as well as a summary of NAAIM’s proprietary Dynamic Asset Allocation Model and Managers Exposure Index. The report is for informational uses only and is not to be construed as investment advice.
Macro Factors Say Side With Bulls
By: David Moenning, Heritage Capital Research
Published: 6.7.23

With the Fed meeting on tap next week it is fairly easy to argue that investors aren’t likely to make major commitments beforehand. So, instead of joining the crowd of prognosticators opining about what the Fed may or may not do, I thought it would be a good idea to spend some time this week looking at the big picture, macro factors…
What Will The Bears Say NOW?
By: Paul Schatz, Heritage Capital LLC
Published: 6.5.23

I lost track of all the pundits and people who came into 2023 so negative, so defensive and so beared up. Those constant calls of a bear market, recession, inflation and the Fed gave me great chuckles for five months. And yes, some, many or much of the data pointed to recession coming, but…
New Highs Ahead?
By: Ryan C. Redfern ShadowRidge Asset Management
Published: 5.26.23

There is a surprising amount of optimism out in the “Active Manager” communities right now, at least for the next few months or even quarters. Both at the CMT Symposium (Chartered Market Technicians) and at NAAIM Uncommon Knowledge (National Association of Active Investment Managers) the general opinion of the market trend was cautiously positive. Sure, there is always the possibility of unforeseen events, but barring that, the market could very well get back to new highs sometime this year…
The Message From the NAAIM Indicator Wall
By: National Association of Active Investment Managers
The NAAIM Indicator Wall provides a weekly update to a robust array of stock market indicators. The “wall” includes readings and explanations of indicators and/or models in the areas of price/trend, momentum, key price levels, overbought/sold readings, sentiment, monetary, economic, inflation, and market cycles.
This time, we’re featuring the Primary Cycle Board , which is designed to identify the primary trend of the overall “state of the stock market.”
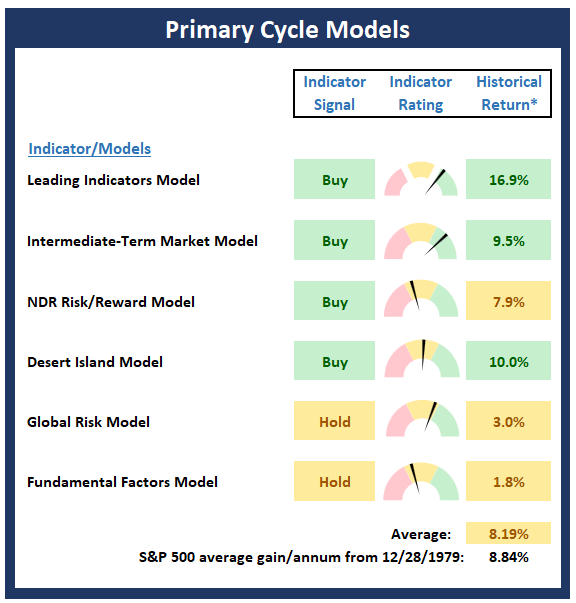
Note: The Indicator Wall is a benefit provided to NAAIM Members and is password protected. To obtain a temporary password, contact NAAIM at 888-261-0787.
Debt Ceiling Is Behind Us
By: Rob Bernstein, RGB Capital Group
Published: 6.5.23

With the debt ceiling bill now behind us, investors will likely focus on incoming inflation data, changes to monetary policy and the potential for a recession…
The World Really IS a Better Place
By: Jim Lee, STRATFI
Published: 6.1.23

The last three years have provided us with one disaster after another. Covid. A flash depression. Inflation. Interest rate hikes. Bank insolvencies. Is it really that bad? Or do we just hear about the bad news? The good news is my favorite market timing sycle flashed a “green light” recently…
The Fly In The Ointment
By: Craig Thompson, President Asset Solutions
Published: 6.5.23

While a great many technical indicators suggest a positive market outlook, there is a notable concern that hinders a more bullish sentiment…
The NAAIM Dynamic Allocation Model
Designed to be a value-add benefit to membership, NAAIM offers a Dynamic Asset Allocation Model based on the NAAIM Indicator Wall of indicators and models. The overall objective of the model portfolio is to dynamically adapt to changing market environments and to keep equity exposure in line with conditions. The model targets a normalized allocation of 60% stocks and 40% Bonds.
Here is this week’s model allocation:
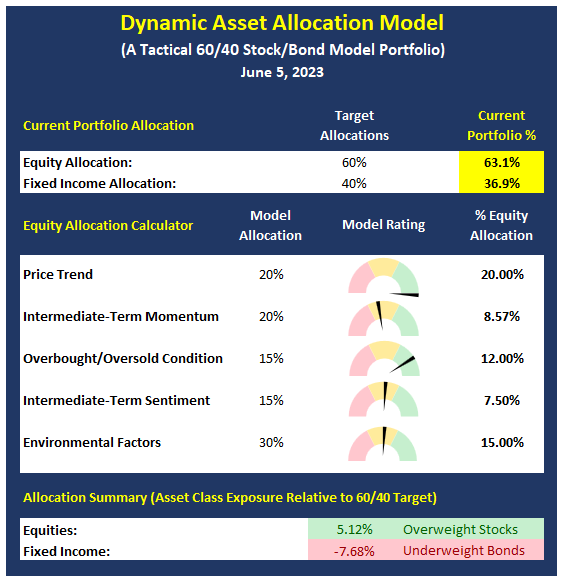
The model has been run live on the NAAIM website for several years and has demonstrated the ability to reduce exposure to market risk during negative environments such as those seen in 2015-16 and 2018.
More on the Dynamic Allocation Model and Historical Readings
The NAAIM Dynamic Allocation Model is for illustrative and informational purposes only, and does not in any way represent an endorsement by NAAIM or an investment recommendation.
Party Like It’s 1999!
By: Sam and Bo Bills Bills Asset Management
Published: 6.2.23

While the current rally is certainly getting long in the tooth and will correct at some point. The behavior certainly brings back memories of the tech fueled rally in 1999 that led to the collapse in 2000-2003. Will history repeat? Again, our crystal ball is a little cloudy, but history does have a tendency to rhyme, so…
Skipping To A Soft Landing?
By: Dexter P. Lyons Issachar Fund
Published: 6.5.23

The market now believes the Fed may pause/skip the next 25bps rate hike planned for June 14th and then raise rates on July 26th. This Fed skip is now expected to produce an economic soft landing instead of the previously predicted crash landing/recession. The major indexes rallied Friday on above-average volume, which could mean the sideline money market investors are getting back in the game…
The NAAIM Member Exposure Index
The NAAIM Exposure Index represents the average exposure to US Equity markets as reported by our members in the organization’s weekly survey. Note that many NAAIM members are risk managers and tend to reduce exposure to the markets during high risk environments.
Click To See the Current Exposure Index
NOT INVESTMENT ADVICE. The analysis and information in this report and on our website is for informational purposes only. No part of the material presented in this report or on our websites is intended as an investment recommendation or investment advice. Neither the information nor any opinion expressed nor any Portfolio constitutes a solicitation to purchase or sell securities or any investment program. The opinions and forecasts expressed are those of the editors and may not actually come to pass. The opinions and viewpoints regarding the future of the markets should not be construed as recommendations of any specific security nor specific investment advice. Investors should always consult an investment professional before making any investment.
Tags: NAAIM, NAAIM Speaks, Stocks market analysis, Stock Market Analysis, Stock market, stock market indicators, David Moenning, Heritage Capital Research, Paul Schatz, Heritage Capital LLC, Rob Bernstein, RGB Capital Group, Ryan Redfern, Shadowridge Asset Management, Sam Bills, Bo Bills, Bills Asset Management, Dexter Lyons, Issachar Fund, Jim Lee, Stratfi, Craig Thompson, Asset Solutions, NAAIM Exposure Index, NAAIM Dynamic Allocation Model


