NAAIM Speaks is monthly newsletter containing market insights and analysis from NAAIM member firms. “Speaks” is designed to provide a plethora of market analysis, indicators, some occasional humor, as well as a summary of NAAIM’s proprietary Dynamic Asset Allocation Model and Managers Exposure Index. The report is for informational uses only and is not to be construed as investment advice.
Bulls (Still) Deserve Benefit of Doubt
By: David Moenning, Heritage Capital Research
Published: 7.12.21

I was recently asked to provide a quick answer to the question “where are we now?” as far as the markets are concerned. While “quick answers” are not usually part of my repertoire, I decided to give it a shot. Cutting to the chase, I believe the stock market is currently in the process reconciling or “dealing with” various cross currents such as the Delta variant, the ultra-hot (and temporary?) inflation data, the Fed’s plans (for tapering their bond-buying program and then, in due course, raising rates), the rate of economic growth going forward, and, of course, the upcoming quarterly earnings parade.
No Signs of Stress, But…
By: Paul Schatz, Heritage Capital LLC
Published: 7.12.21

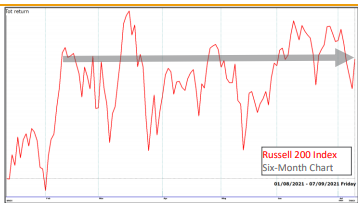
On Friday, we had the Dow Industrials, S&P 500 and NASDAQ 100 all at new highs. The S&P 400 and Russell 2000 were absent. It just didn’t seem like a celebratory day. Perhaps, it was because the rising tide is not lifting all ships as I mentioned on Thursday. But the market is also not showing stress on the credit side either. But…
The Dashboard: Neutral and Weakening
By: Ryan C. Redfern ShadowRidge Asset Management
Published: 6.25.21
As of Thursday night, our Shadowridge Dashboard is showing Positive to Negative sectors as 5 to 6 which is fairly neutral and weakening. While many sectors are struggling, the NASDAQ, which had been lagging behind all year, has re-emerged as the one strong place in the market. We’re still looking at the Shiller PE ratio (see last month’s chart) and wondering how much longer the market can stay positive. Based on this data, we’re now seeing several projections for the S&P500 index to be flat to slightly negative over the next decade…
The Message From the NAAIM Indicator Wall
By: National Association of Active Investment Managers
Updated: 3.1.21
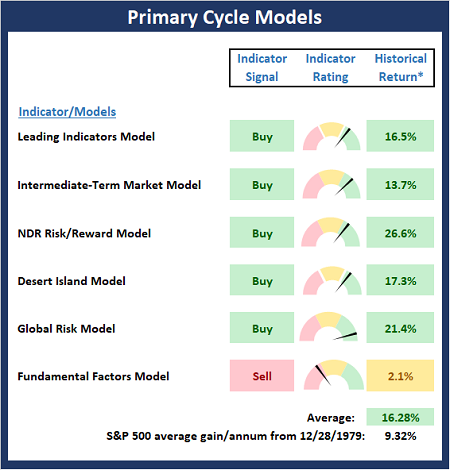
The NAAIM Indicator Wall provides a weekly update to a robust array of stock market indicators. The “wall” includes readings and explanations of indicators and/or models in the areas of price/trend, momentum, key price levels, overbought/sold readings, sentiment, monetary, economic, inflation, and market cycles.
This time, we’re featuring the Primary Model Board , which is designed to identify the primary trend of the overall “state of the stock market.”
Note: The Indicator Wall is a benefit provided to NAAIM Members and is password protected. To obtain a temporary password, contact NAAIM at 888-261-0787.
A House (er Market) Divided
By: Rob Bernstein, RGB Capital Group
Published: 7.12.21
Not much has changed in the market over the last week with a divided stock market environment.
Is Breadth a Problem?
By: Craig Thompson, President Asset Solutions
Published: 7.5.21
The S&P 500 Index broke out to new all-time highs recently (see chart below). This is a bullish market event. That being said, the advance occurred in combination with poor market breadth. Meaning that there are a large number of stocks within the index that are not advancing to new highs…
The NAAIM Dynamic Allocation Model
Designed to be a value-add benefit to membership, NAAIM offers a Dynamic Asset Allocation Model based on the NAAIM Indicator Wall of indicators and models. The overall objective of the model portfolio is to dynamically adapt to changing market environments and to keep equity exposure in line with conditions. The model targets a normalized allocation of 60% stocks and 40% Bonds.
Here is this week’s model allocation:
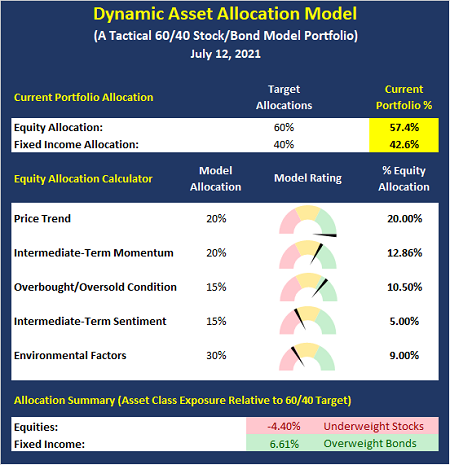
The model has been run live on the NAAIM website for several years and has demonstrated the ability to reduce exposure to market risk during negative environments such as those seen in 2015-16 and 2018.
More on the Dynamic Allocation Model and Historical Readings
The NAAIM Dynamic Allocation Model is for illustrative and informational purposes only, and does not in any way represent an endorsement by NAAIM or an investment recommendation.
A Very Unusual Market
By: Sam and Bo Bills Bills Asset Management
Published: 7.9.21

Normally, a fall in yields would indicate a weakening economy and that nervous traders were fleeing to the safety of
treasuries – driving the yield down as demand outstripped supply. However, the recent fall has been accompanied by higher
equity prices. It is just one more unusual factor in this unusual market…
Growth Back In Favor
By: Dexter P. Lyons Issachar Fund
Published: 7.12.21

2nd quarter earnings season kicks off this week, and I expect earnings to come in better than expected, providing a catalyst for the market to trend higher. The reopen trade seems to be fading, and the growth trade, especially in the cloud space, appears to be in favor…
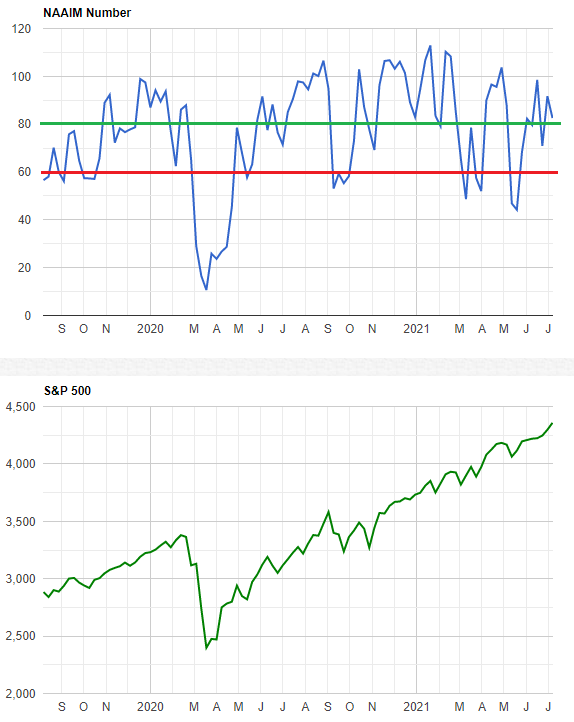
The NAAIM Member Exposure Index
The NAAIM Exposure Index represents the average exposure to US Equity markets as reported by our members in the organization’s weekly survey. Note that many NAAIM members are risk managers and tend to reduce exposure to the markets during high risk environments.
NOT INVESTMENT ADVICE. The analysis and information in this report and on our website is for informational purposes only. No part of the material presented in this report or on our websites is intended as an investment recommendation or investment advice. Neither the information nor any opinion expressed nor any Portfolio constitutes a solicitation to purchase or sell securities or any investment program. The opinions and forecasts expressed are those of the editors and may not actually come to pass. The opinions and viewpoints regarding the future of the markets should not be construed as recommendations of any specific security nor specific investment advice. Investors should always consult an investment professional before making any investment.
Tags: NAAIM, NAAIM Speaks, Stocks market analysis, Stock Market Analysis, Stock market, stock market indicators, David Moenning, Paul Schatz, Rob Bernstein, Ryan Redfern, Sam Bills, Bo Bills, Dexter Lyons, Craig Thompson, NAAIM Exposure Index, NAAIM Dynamic Allocation Model