NAAIM Speaks is monthly newsletter containing market insights and analysis from NAAIM member firms. This newsletter is designed to provide a plethora of market analysis, indicators, some occasional humor, as well as a summary of NAAIM’s proprietary Dynamic Asset Allocation Model and Managers Exposure Index. The report is for informational uses only and is not to be construed as investment advice.
Historical Cycles Disagree with Wall Street Outlook
By: David Moenning, Heritage Capital Research
Published: 1.10.23

In my last meandering market missive, I opined that analysts of all shapes and sizes were pretty much singing the same song right now regarding the outlook for the economy, inflation, corporate earnings, and in turn, the stock market. In short, everyone is looking for stocks to fall in the first half of 2023. However, the historical cycles are singing a very different tune…
2023 Fearless Forecast – The Year of the Bull
By: Paul Schatz, Heritage Capital LLC
Published: 1.7.23

Each and every year, I spend some time in Q4 collecting my thoughts about how I see the next 12 months unfolding in the financial markets, economy, etc. While I do really enjoy looking into my super secret crystal ball as I do throughout the year, I also know that it’s a fairly futile exercise to forecast 12 months out. I will say this, though. Whether by a lot of luck or by a little skill, I haven’t seen anyone achieve the hit rate that I have with annual forecasts. I don’t equivocate. I don’t use the ole, “on the one hand…”. And I never revise history nor argue that the market was wrong…
“If Santa fails to call…”
By: Ryan C. Redfern ShadowRidge Asset Management
Published: 12.30.22

It’s “Santa Clause Rally” time and Santa is nowhere in sight! Historically, the last 5 trading days of December and the first two trading days of January are when that rally is supposed to happen. But this year, it looks like we (the collective “we”) might be on the “naughty” list…
The Message From the NAAIM Indicator Wall
By: National Association of Active Investment Managers
The NAAIM Indicator Wall provides a weekly update to a robust array of stock market indicators. The “wall” includes readings and explanations of indicators and/or models in the areas of price/trend, momentum, key price levels, overbought/sold readings, sentiment, monetary, economic, inflation, and market cycles.
This time, we’re featuring the Trend Indicator Board , which is designed to tell us about the overall technical health of the market’s trend.
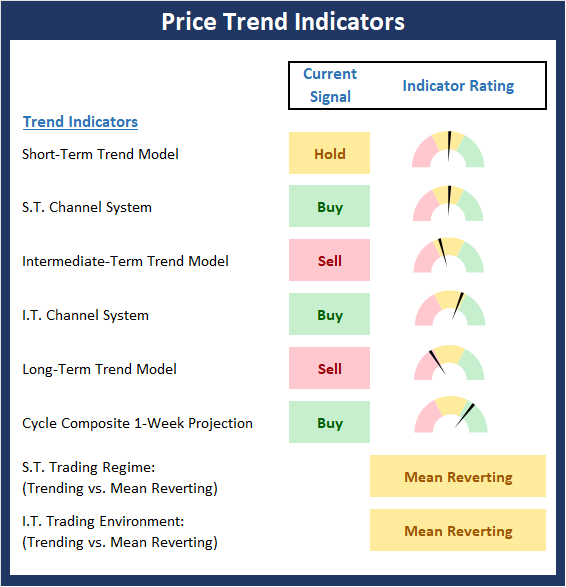
Note: The Indicator Wall is a benefit provided to NAAIM Members and is password protected. To obtain a temporary password, contact NAAIM at 888-261-0787.
Conflicting Signals
By: Rob Bernstein, RGB Capital Group
Published: 1.9.23

The stock market continues to oscillate as the Federal Reserve
sticks with their aggressive monetary policy (negative for the
market) and economic reports indicate that inflation is easing
(positive for the market). The December payroll report sent
the S&P 500 Index higher on Friday as it suggested that the
labor market might be softening with wages increasing at a
slower pace and news of additional layoffs. However, the
intermediate-term trend is less certain and the long-term
trend remains down…
Signs of a Tradable Rally
By: Craig Thompson, President Asset Solutions
Published: 1.8.23

I am seeing signs that the stock market could be entering a period of short-term strength within a longer-term downtrend…
The NAAIM Dynamic Allocation Model
Designed to be a value-add benefit to membership, NAAIM offers a Dynamic Asset Allocation Model based on the NAAIM Indicator Wall of indicators and models. The overall objective of the model portfolio is to dynamically adapt to changing market environments and to keep equity exposure in line with conditions. The model targets a normalized allocation of 60% stocks and 40% Bonds.
Here is this week’s model allocation:
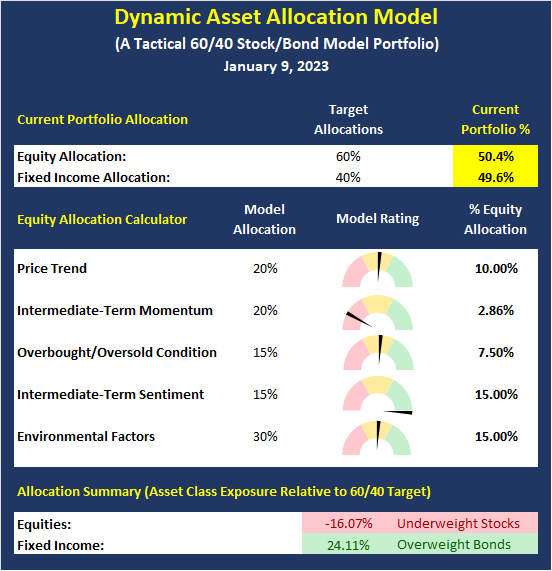
The model has been run live on the NAAIM website for several years and has demonstrated the ability to reduce exposure to market risk during negative environments such as those seen in 2015-16 and 2018.
More on the Dynamic Allocation Model and Historical Readings
The NAAIM Dynamic Allocation Model is for illustrative and informational purposes only, and does not in any way represent an endorsement by NAAIM or an investment recommendation.
Bulls Jumping the Gun – Again
By: Sam and Bo Bills Bills Asset Management
Published: 1.6.23

This latest jobs report sparked a big rally in the equity markets. On the surface, the report itself seemed rather benign if
not negative for the markets. The headline jobs numbers exceeded expectations with more jobs created than the consensus
estimates. However, market bulls took the underlying decline in wages as a positive sign that would put pressure on the Fed to
slow their pace of interest rate increases. We suspect the bulls are jumping the gun – again…
All That Glitters
By: Dexter P. Lyons Issachar Fund
Published: 1.9.23

Every new year brings new investing themes where big institutions realign their portfolios, hoping to profit in the coming year. I see early signs of big money moving into the Energy, Medical, and Machinery Sectors as stock prices rise on above-average volumes. 2023 could be the year Gold shines, as it has been in an uptrend since bottoming last November on above-average volumes…
The NAAIM Member Exposure Index
The NAAIM Exposure Index represents the average exposure to US Equity markets as reported by our members in the organization’s weekly survey. Note that many NAAIM members are risk managers and tend to reduce exposure to the markets during high risk environments.
Click To See the Current Exposure Index
NOT INVESTMENT ADVICE. The analysis and information in this report and on our website is for informational purposes only. No part of the material presented in this report or on our websites is intended as an investment recommendation or investment advice. Neither the information nor any opinion expressed nor any Portfolio constitutes a solicitation to purchase or sell securities or any investment program. The opinions and forecasts expressed are those of the editors and may not actually come to pass. The opinions and viewpoints regarding the future of the markets should not be construed as recommendations of any specific security nor specific investment advice. Investors should always consult an investment professional before making any investment.
Tags: NAAIM, NAAIM Speaks, Stocks market analysis, Stock Market Analysis, Stock market, stock market indicators, David Moenning, Paul Schatz, Rob Bernstein, Ryan Redfern, Sam Bills, Bo Bills, Dexter Lyons, Craig Thompson, NAAIM Exposure Index, NAAIM Dynamic Allocation Model