


NAAIM Speaks is bi-monthly newsletter containing market insights and analysis from NAAIM member firms. “Speaks” is designed to provide a plethora of market analysis, indicators, some occasional humor, as well as a summary of NAAIM’s proprietary Dynamic Asset Allocation Model and Managers Exposure Index. The report is for informational uses only and is not to be construed as investment advice.
Here We Go Again
By: Paul Schatz, Heritage Capital LLC
Published: 8.5.19

It’s been a tough three days for the bulls that is about to get worse as China retaliated for Trump’s tariffs with a series of their own. Their currency, the yuan, also fell below what analysts have deemed “critical” levels. It has long been argued that by weakening their currency, China has been able to partially offset the impact of the tariffs.
I won’t get into another diatribe about how I detest and hate using tariffs as part of economic policy. It’s flawed and failed thinking where they are only losers. No one wins a trade war. But…
Fear Induced Trading Mistakes
By: Jeffrey Miller Dash of Insight
Published: 8.6.19

Fear induced trading is usually a bad idea. Whether you are afraid the sky is falling or you’re afraid of missing out on the next big buying opportunity, the results can be less than ideal. Our current market sell-off (over the last week) has many investors fearful, and that’s when unnecessary trading mistakes are often made. Are you resisting the urge to trade out of fear?…
I’ll Let The Models Do The Talking
By: David Moenning, Heritage Capital Research
Published: 8.5.19
It’s been a hectic travel weekend and I’m still on the road. And with all the news flying around at the moment, I’m spending a lot of time analyzing the situation. As such, I’m going to let the indicators do the talking this morning…
The Message From the NAAIM Indicator Wall: The Fundies Are Solid
By: National Association of Active Investment Managers
Updated: 8.5.19
The NAAIM Indicator Wall provides a weekly update to a robust array of stock market indicators. The “wall” includes readings and explanations of indicators and/or models in the areas of price/trend, momentum, key price levels, overbought/sold readings, sentiment, monetary, economic, inflation, and market cycles.
This week, we’re featuring the Fundamental Factors Board, which is designed to indicate the “state” of the market’s fundamental backdrop.
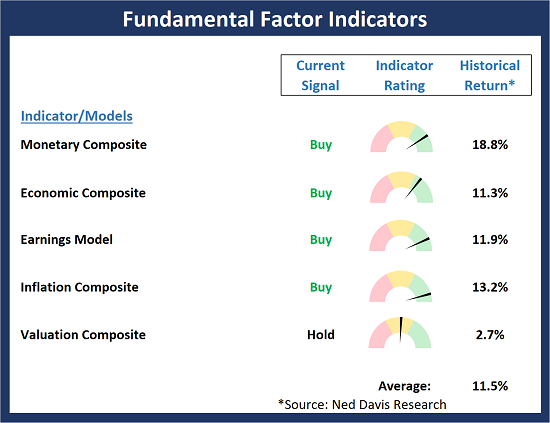
Trade may be the focal point from a short-term perspective and it is clear that fear/uncertainty is elevated. But from a longer-term macro/fundamental point of view, this indicator board suggests that the backdrop remains in good shape.
Note: The Indicator Wall is a benefit provided to NAAIM Members and is password protected. To obtain a temporary password, contact NAAIM at 888-261-0787.
Keep An Eye On The Bounce
By: Rob Bernstein, RGB Capital Group
Published: 8.5.19

The market is oversold on a short-term basis and is due for some type of bounce in the near future. The nature of that
bounce will give us clues as to whether this is the beginning of a potentially longer-term decline or if this is another bout of short-term volatility that has become common place over the last few years.
Our Take: Market Risk Is Elevated
By: Craig Thompson, Asset Solutions
Published: 8.5.19

As mentioned in my June 24, 2019 market update: Stock Market Walking a Tightrope, the stock market had many longer-term negative divergences that I felt increased market risk over the intermediate-term. I indicated that these divergences were only red flags until the major market indexes broke down.
Over the past four trading days, we have seen the broad stock market break decisively to the downside. This drop along with the longer-term negative divergences that I spoke about in that update suggest that market risk is now officially elevated and odds favor additional market weakness over the near-term.
Below is a video that highlights our points…
Update: The NAAIM Dynamic Allocation Model
Designed to be a value-add benefit to membership, NAAIM offers a Dynamic Asset Allocation Model based on the NAAIM Indicator Wall of indicators and models. The overall objective of the model portfolio is to dynamically adapt to changing market environments and to keep equity exposure in line with current conditions. The model targets a normalized allocation of 60% stocks and 40% Bonds.
Here is this week’s model allocation:
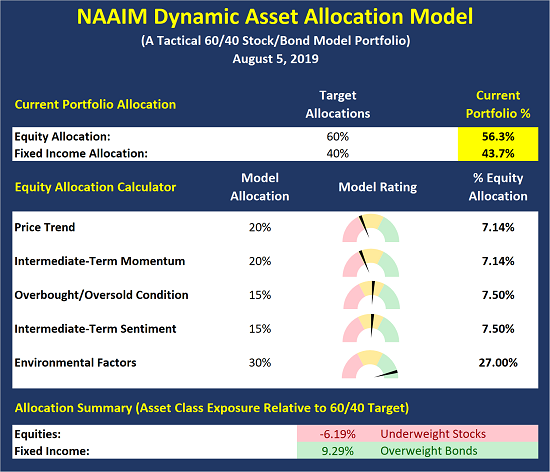
The model has been run live on the NAAIM website for several years and has demonstrated the ability to reduce exposure to market risk during negative environments such as those seen in 2015-16 and 2018.
More on the Dynamic Allocation Model and Historical Readings
The NAAIM Dynamic Allocation Model is for illustrative and informational purposes only, and does not in any way represent an endorsement by NAAIM or an investment recommendation.
Trade Winds Gusting
By: Sam and Bo Bills Bills Asset Management
Published: 8.2.19
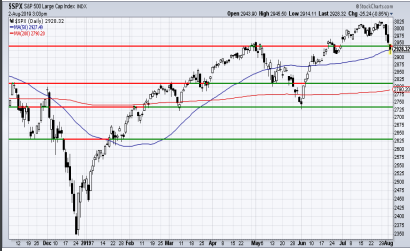
The support and resistance lines that we have been carrying forward for several weeks now have come back into play with the week’s weakness. The S&P dropped back below support at the previous highs. A few days below support can be weathered but if the bulls aren’t able to establish a rebound next week then we may be stuck back in the long-term
trading range that has persisted for much of the last 4 months. As we surmised, volatility did increase this week…
Volatility Tells A Story
By: Ryan C. Redfern ShadowRidge Asset Management
Published: 7.31.19
![]()
An interesting point to consider: by our estimation, we are now at 2 standard deviations of volatility above where the S&P 5001 started the year. This data comes from the options market, which is beyond the scope of this newsletter. The main point is that this data shows a probability of 95.4% that the stock market is at its high point for the year. It’s been a good year so far, but we’re now looking at the possibility of the market giving back many of the gains by year-end. It’s not something we expect to happen, but a possibility that has to be considered….
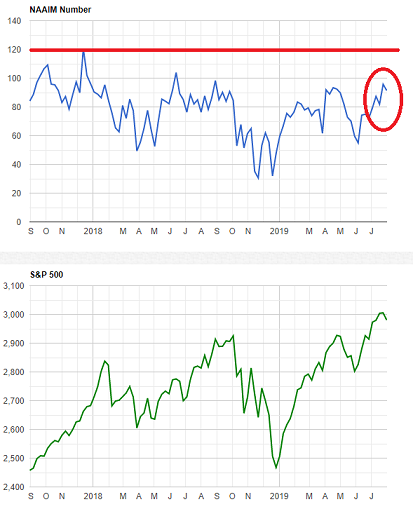
The NAAIM Member Exposure Index: Managers Remained Cautious
The NAAIM Exposure Index represents the average exposure to US Equity markets as reported by our members in the organization’s weekly survey. Note that many NAAIM members are risk managers and tend to reduce exposure to the markets during high risk environments.
Below is last week’s exposure reading. We note that while managers were willing to stay aboard the bull train, they remained cautious relative to exposure levels in late 2017…
More on the NAAIM Exposure Index
NOT INVESTMENT ADVICE. The analysis and information in this report and on our website is for informational purposes only. No part of the material presented in this report or on our websites is intended as an investment recommendation or investment advice. Neither the information nor any opinion expressed nor any Portfolio constitutes a solicitation to purchase or sell securities or any investment program. The opinions and forecasts expressed are those of the editors and may not actually come to pass. The opinions and viewpoints regarding the future of the markets should not be construed as recommendations of any specific security nor specific investment advice. Investors should always consult an investment professional before making any investment.
Tags: NAAIM, NAAIM Speaks, Stocks market analysis, Stock Market Analysis, Stock market, stock market indicators, David Moenning, Paul Schatz, Jeffrey Miller, Rob Bernstein, Sam Bills, Bo Bills, Ryan Redfern, Craig Thompson, NAAIM Exposure Index, NAAIM Dynamic Allocation Model


