


NAAIM Speaks is monthly newsletter containing market insights and analysis from NAAIM member firms. “Speaks” is designed to provide a plethora of market analysis, indicators, some occasional humor, as well as a summary of NAAIM’s proprietary Dynamic Asset Allocation Model and Managers Exposure Index. The report is for informational uses only and is not to be construed as investment advice.
Four Keys To This Market
By: David Moenning, Heritage Capital Research
Published: 7.6.20

I didn’t spend much time in front of the computer this weekend. So as the screens begin to blink on this fine Monday morning, I thought I’d review the key points running through my head as I reengage with the markets and ponder the state of economy and the COVID crisis. Cutting to the chase, there are four points I’d like to make here…
This Bull’s Rising Tide is Not Lifting All Ships
By: Paul Schatz, Heritage Capital LLC
Published: 6.5.20

The stock market continues to be a tale of almost all stocks in one corner and a select few NASDAQ behemoths in the other. The Dow Industrials continue to behave poorly and lag the other major indices. The mid and small caps did really well through early June and the S&P 500 has been okay. The NASDAQ 100 has partied like it’s 1999 again, something I still believe continues in the short-term, but cedes to the other indices later this quarter.
Don’t Look Back!
By: Jeffrey Miller Dash of Insight
Published: 7.4.20

The economic news, once again, got better, and pandemic news, once again, got worse. The market rose nicely, reassuring many investors. Instead of looking at the modest economic rebound, investors should be paying attention to Satchel Paige, who famously said, “Don’t look back; something might be gaining on you.” For many reasons, our attention is currently focused on the “now” and the recent past. How can investors best look forward?
The Message From the NAAIM Indicator Wall: The Primary Cycle is Positive
By: National Association of Active Investment Managers
Updated: 3.2.20
The NAAIM Indicator Wall provides a weekly update to a robust array of stock market indicators. The “wall” includes readings and explanations of indicators and/or models in the areas of price/trend, momentum, key price levels, overbought/sold readings, sentiment, monetary, economic, inflation, and market cycles.
This time, we’re featuring the Primary Board , which is designed to identify the primary trend of the overall “state of the stock market.”

Note: The Indicator Wall is a benefit provided to NAAIM Members and is password protected. To obtain a temporary password, contact NAAIM at 888-261-0787.
Staying Active Has Paid Off This Year
By: Ryan C. Redfern ShadowRidge Asset Management
Published: 6.27.20

As the first half of 2020 comes to a close, we reflect that we could not have imagined the struggles and difficulties the world has seen this year. But, as with all human struggles, we keep going. It’s been inspiring to see some of the creative and caring acts that have occurred over the past several months. And as for the stock market and our clients’ accounts, we will remain vigilant as always, and keep hope for brighter days eventually. Our models and allocations have focused on either being defensive or in the stronger markets. The NASDAQ 100 has been a core holding this year, and it’s keeping us largely positive (or very close) while much of the market is struggling. This is where we believe being active pays off.
Avoid The Noise
By: Rob Bernstein, RGB Capital Group
Published: 7.6.20

The market’s trading range represents a balance between buyers and sellers. At some point this balance will tip in favor of one of these groups. If buyers dominate the market, stock and junk bond prices will rise above the top of the range. If sellers overwhelm buyers then the opposite will happen and prices will decline. Until that time, the movement within these trading ranges is not that significant.
The NAAIM Dynamic Allocation Model
Designed to be a value-add benefit to membership, NAAIM offers a Dynamic Asset Allocation Model based on the NAAIM Indicator Wall of indicators and models. The overall objective of the model portfolio is to dynamically adapt to changing market environments and to keep equity exposure in line with conditions. The model targets a normalized allocation of 60% stocks and 40% Bonds.
Here is this week’s model allocation:
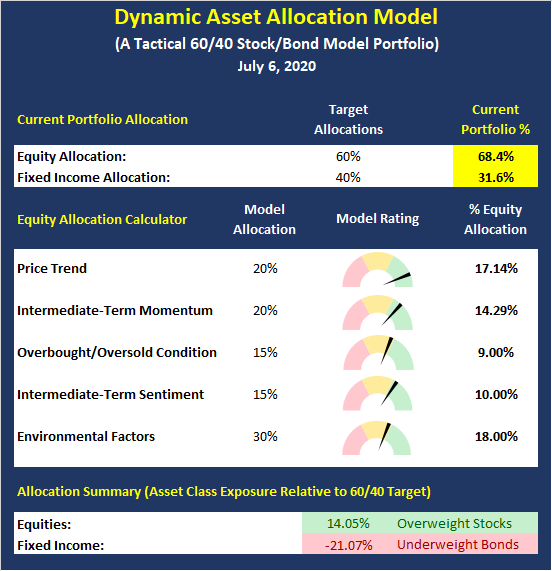
The model has been run live on the NAAIM website for several years and has demonstrated the ability to reduce exposure to market risk during negative environments such as those seen in 2015-16 and 2018.
More on the Dynamic Allocation Model and Historical Readings
The NAAIM Dynamic Allocation Model is for illustrative and informational purposes only, and does not in any way represent an endorsement by NAAIM or an investment recommendation.
Reality Hits Hard
By: Sam and Bo Bills Bills Asset Management
Published: 6.5.20
![]()
Over the last few weeks can be attributed to the rise in coronavirus cases and the threat of slowing down the pace of recovery. As we have written here for the last several weeks, the pace of the recovery in the markets were at odds with the pace of recovery in the economy. Perhaps the market is beginning to factor in something less than an uninterrupted recovery. While there is risk to the downside from current levels, we do not believe that a retest of the March lows is likely. As mentioned above, however, we do believe that another 5-10% downside from here is entirely possible.
Video Review
By: Craig Thompson, President Asset Solutions
Published: 6.21.20
In the market update video below I highlight those bearish factors and give you my take on where I see the market going in the coming days and weeks. Also, I share with you how our clients are currently allocated and how we may reallocate them going forward.
Why Is The Fed’s Balance Sheet Shrinking?
By: Dexter P. Lyons Issachar Fund
Published: 7.6.20

I am getting more concerned as to why the Fed is reducing its balance sheet in a struggling economy. If I were Jay Powell, Fed Chair, and I wanted to please the man who gave me my job, Donald Trump, I would certainly not do anything that could potentially hurt his chances of getting re-elected as President. However, the Fed has been reducing its balance sheet in the last three weeks by about $160 billion. From 2/28/20 to 6/16/20, the Fed increased its balance sheet consistently week after week from $4 trillion to over $7 trillion. The market bottomed on 3/23/20 which about three weeks after the Fed started expanding its balance sheet and has been rising in sync with the Fed’s bloating balance sheet. Will the market continue to lag the Fed’s balance sheet growth by three weeks and head lower into the election? I certainly hope not but I will attempt to act accordingly if it does.
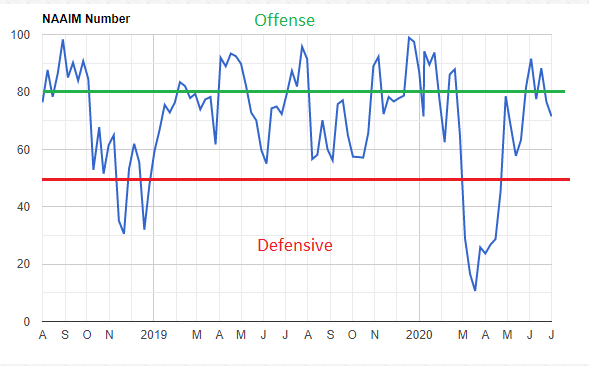
The NAAIM Member Exposure Index: Managers Are Onboard
The NAAIM Exposure Index represents the average exposure to US Equity markets as reported by our members in the organization’s weekly survey. Note that many NAAIM members are risk managers and tend to reduce exposure to the markets during high risk environments.
The last week’s exposure reading was 71.5, which remains a Moderately Positive reading.
More on the NAAIM Exposure Index
NOT INVESTMENT ADVICE. The analysis and information in this report and on our website is for informational purposes only. No part of the material presented in this report or on our websites is intended as an investment recommendation or investment advice. Neither the information nor any opinion expressed nor any Portfolio constitutes a solicitation to purchase or sell securities or any investment program. The opinions and forecasts expressed are those of the editors and may not actually come to pass. The opinions and viewpoints regarding the future of the markets should not be construed as recommendations of any specific security nor specific investment advice. Investors should always consult an investment professional before making any investment.
Tags: NAAIM, NAAIM Speaks, Stocks market analysis, Stock Market Analysis, Stock market, stock market indicators, David Moenning, Paul Schatz, Jeffrey Miller, Rob Bernstein, Ryan Redfern, Sam Bills, Bo Bills, Dexter Lyons, Craig Thompson, Len Fox, NAAIM Exposure Index, NAAIM Dynamic Allocation Model


