


NAAIM Speaks is monthly newsletter containing market insights and analysis from NAAIM member firms. This newsletter is designed to provide a plethora of market analysis, indicators, some occasional humor, as well as a summary of NAAIM’s proprietary Dynamic Asset Allocation Model and Managers Exposure Index. The report is for informational uses only and is not to be construed as investment advice.
As January Goes, So Goes…
By: David Moenning, Heritage Capital Research
Published: 2.6.23

When the calendar page flips from the end of one year to the start of the next, there are several historical tendencies to observe. And given that many of these seasonal trends involve the performance of the stock market during the month of January, I thought this might be a good time to check in on the various trading tendencies and “rules” for the year…
Is Good News Bad Again?
By: Paul Schatz, Heritage Capital LLC
Published: 2.6.23

On Friday, the government announced that 517,000 new jobs were created in January. That’s about what I would expect. If the economy had just troughed and a new expansion was beginning. 500,000 new jobs almost two years into a recovery is almost unheard of. I thought it was a typo when I saw it…
The Year of The Rabbit
By: Ryan C. Redfern ShadowRidge Asset Management
Published: 1.27.23

Since I was born in the year of the Rabbit, I’m excited about what is possible. And since the Rabbit is a symbol of peace and prosperity, I like what that means for 2023.
After a slow start to January, the stock market seems to share my optimism for the year ahead. The most interesting twist or change from the prior year is that the NASDAQ / Growth stocks are starting to look stronger than the S&P500 / Value stocks side of the market. If that continues to hold, we view that as a positive environment for the near, and hopefully extended, future!
The Message From the NAAIM Indicator Wall
By: National Association of Active Investment Managers
The NAAIM Indicator Wall provides a weekly update to a robust array of stock market indicators. The “wall” includes readings and explanations of indicators and/or models in the areas of price/trend, momentum, key price levels, overbought/sold readings, sentiment, monetary, economic, inflation, and market cycles.
This time, we’re featuring the Momentum Indicator Board , which is designed to tell us determine if there is any “oomph” behind a move in the market.
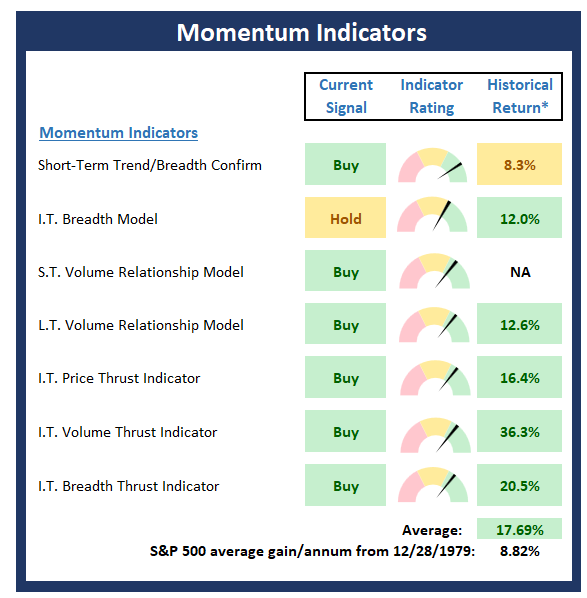
Note: The Indicator Wall is a benefit provided to NAAIM Members and is password protected. To obtain a temporary password, contact NAAIM at 888-261-0787.
Jay Powell Is Changing His Tune
By: Rob Bernstein, RGB Capital Group
Published: 2.6.23

As widely expected, the Federal Open Market Committee (FOMC) raised short-term interest rates last week 0.25% to a
range of 4.50% – 4.75%; the highest level in 15 years. In the press conference that followed that meeting, Fed Chairman
Jerome Powell recognized that the results of the FOMC’s aggressive monetary policy decisions last year were starting to
impact the economy as the rate of price increases has steadily declined over the last six months. The markets rallied on the
news anticipating that the Fed will be able to stop raising short-term rates soon…
Make Hay While The Sun Shines
By: Craig Thompson, President Asset Solutions
Published: 2.6.23

In our last market update, I wrote about how market technicals were improving. That improvement has continued and the market is displaying strength that we have not seen in over a year. Here is a rundown of the positive developments that have occurred recently: Market breadth continues to strengthen. Sentiment has shifted to a decidedly risk-on environment. This suggests that stocks are likely to advance…
The NAAIM Dynamic Allocation Model
Designed to be a value-add benefit to membership, NAAIM offers a Dynamic Asset Allocation Model based on the NAAIM Indicator Wall of indicators and models. The overall objective of the model portfolio is to dynamically adapt to changing market environments and to keep equity exposure in line with conditions. The model targets a normalized allocation of 60% stocks and 40% Bonds.
Here is this week’s model allocation:
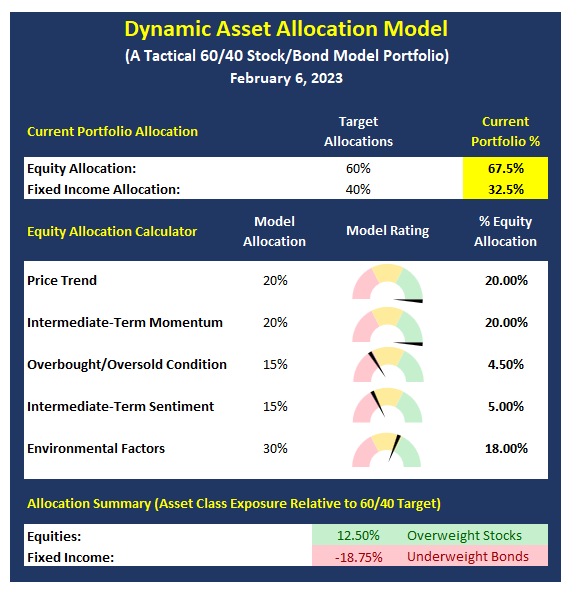
The model has been run live on the NAAIM website for several years and has demonstrated the ability to reduce exposure to market risk during negative environments such as those seen in 2015-16 and 2018.
More on the Dynamic Allocation Model and Historical Readings
The NAAIM Dynamic Allocation Model is for illustrative and informational purposes only, and does not in any way represent an endorsement by NAAIM or an investment recommendation.
Good News, Bad News – Doesn’t Matter
By: Sam and Bo Bills Bills Asset Management
Published: 2.3.23

This market wants to go up. Over the last 2 weeks the S&P has definitively broken the down-trend line that began last
year and is now at the June of 2022 highs and approaching the bear market rally of last August. While some can make a
relatively compelling argument that this is just another bear market rally in a longer-term bear market, the argument is
getting weaker with each new thrust up in the market. You cannot argue with price, and we are in an intermediate
uptrend that cannot be ignored…
Money Flowing Back Into Tech
By: Dexter P. Lyons Issachar Fund
Published: 2.6.23

I believe money is rotating out of energy into technology as the dollar rallies, putting pressure on commodity prices. Oil trades in dollars, so when the dollar strengthens, commodity prices like oil tend to fall in price. Declining oil prices are a headwind for energy stocks, so I did not want to overstay our welcome in energy. A rising dollar also pressures emerging market equities, so I expect money to flow back into the US, supporting equity prices. I like how stocks have been breaking out on strong volume after earnings, and these stocks have been holding their gains…
The NAAIM Member Exposure Index
The NAAIM Exposure Index represents the average exposure to US Equity markets as reported by our members in the organization’s weekly survey. Note that many NAAIM members are risk managers and tend to reduce exposure to the markets during high risk environments.
Click To See the Current Exposure Index
NOT INVESTMENT ADVICE. The analysis and information in this report and on our website is for informational purposes only. No part of the material presented in this report or on our websites is intended as an investment recommendation or investment advice. Neither the information nor any opinion expressed nor any Portfolio constitutes a solicitation to purchase or sell securities or any investment program. The opinions and forecasts expressed are those of the editors and may not actually come to pass. The opinions and viewpoints regarding the future of the markets should not be construed as recommendations of any specific security nor specific investment advice. Investors should always consult an investment professional before making any investment.
Tags: NAAIM, NAAIM Speaks, Stocks market analysis, Stock Market Analysis, Stock market, stock market indicators, David Moenning, Paul Schatz, Rob Bernstein, Ryan Redfern, Sam Bills, Bo Bills, Dexter Lyons, Craig Thompson, NAAIM Exposure Index, NAAIM Dynamic Allocation Model


