NAAIM Speaks is monthly newsletter containing market insights and analysis from NAAIM member firms. This newsletter is designed to provide a plethora of market analysis, indicators, some occasional humor, as well as a summary of NAAIM’s proprietary Dynamic Asset Allocation Model and Managers Exposure Index. The report is for informational uses only and is not to be construed as investment advice.
The Words Matter
By: David Moenning, Heritage Capital Research
Published: 12.6.23

Stop me if you’ve heard this one before. Pullbacks in the markets end quickly when some Fed official, or better yet, a couple FOMC members say something “dovish.” You know, something like, “We see signs of progress on inflation.” Or “Policy is appropriate given the current data.” Or, well, anything including the words “rates” and “cuts” in the same paragraph. Almost instantly, the computers of Wall Street’s high speed trading crowd start buying in response. Never mind the fact that…
But Paul, What About…
By: Paul Schatz, Heritage Capital LLC
Published: 12.4.23

For most of the year, all we heard about was that 7 or 8 stocks were the only ones going up while 493 languished. That’s not exactly true, but you get the picture. Additionally, I consistently pushed back that if you know the market was being dominated by a handful of stocks, no one was preventing you from owning some. Bears didn’t like that argument….
Getting Back In The Game
By: Ryan C. Redfern ShadowRidge Asset Management
Published: 11.24.23

But now, seasonality suggests that while November is a solidly positive month (and so far, so good), the first days of December can tend to be the start of a small pull-back before getting into the “Santa Clause Rally” season – which includes the days following Christmas, not leading up to them as so many clueless pundits are saying. To add another layer of complexity, we are in the 3rd year of the Election Cycle. Based on data …
The Message From the NAAIM Indicator Wall
By: National Association of Active Investment Managers
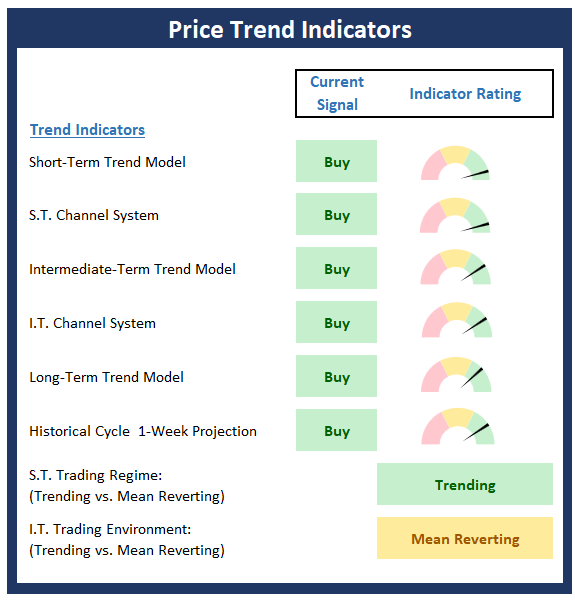
The NAAIM Indicator Wall provides a weekly update to a robust array of stock market indicators. The “wall” includes readings and explanations of indicators and/or models in the areas of price/trend, momentum, key price levels, overbought/sold readings, sentiment, monetary, economic, inflation, and market cycles.
This time, we’re featuring the Trend Board , which is designed to tell us about the overall technical health of the market’s trend.
Note: The Indicator Wall is a benefit provided to NAAIM Members and is password protected. To obtain a temporary password, contact NAAIM at 888-261-0787.
The Fed is Done
By: Rob Bernstein, RGB Capital Group
Published: 12.4.23

It is widely expected that the Fed is done with the current
cycle of interest rate hikes and many believe they will start
decreasing rates by the middle of next year. This has led to a
sharp decline in interest rates across the yield curve over the
past month and a surge in bond prices. The RGB Treasury
Bond Index is surging higher as bond yields and bond prices
move in opposite directions…
Bullish Breakout
By: Craig Thompson, President Asset Solutions
Published: 11.27.23

After reaching overbought levels and pulling back from August through October, the market has decisively broken out to the upside. The strength of the move suggests that the path of least resistance over the coming weeks and months is higher. That being said, the market is short-term overbought, and the S&P 500 Index is sitting right at major resistance. Thus, the market may pull back/consolidate before making another run higher. Any short-term market weakness should be viewed as a buying opportunity…
The NAAIM Dynamic Allocation Model
Designed to be a value-add benefit to membership, NAAIM offers a Dynamic Asset Allocation Model based on the NAAIM Indicator Wall of indicators and models. The overall objective of the model portfolio is to dynamically adapt to changing market environments and to keep equity exposure in line with conditions. The model targets a normalized allocation of 60% stocks and 40% Bonds.
Here is this week’s model allocation:
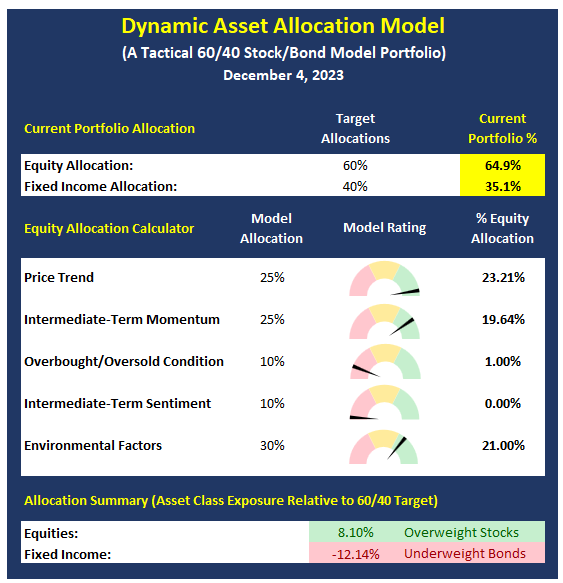
The model has been run live on the NAAIM website for several years and has demonstrated the ability to reduce exposure to market risk during negative environments such as those seen in 2015-16 and 2018.
More on the Dynamic Allocation Model and Historical Readings
The NAAIM Dynamic Allocation Model is for illustrative and informational purposes only, and does not in any way represent an endorsement by NAAIM or an investment recommendation.
Is GDI Telling True Economic Story?
By: Bo Bills Bills Asset Management
Published: 12.1.23

Gross Domestic Income (GDI) is another measure of economic output. Usually, GDP and GDI approximate each other. However, for the third quarter, GDI rose at an annualized 1.5% rate. Over the last year, GDI has fallen .16% versus a gain in GDP of 3%. Something is amiss. Over the coming months, these numbers should converge. The question is whether GDP falls or GDI rises. The answer to that question will likely show whether or not we are heading towards a recession or not…
Sideways Is The New Down
By: Dexter P. Lyons Issachar Fund
Published: 12.4.23

The S&P 500 and NASDAQ 100 have been consolidating gains and trading sideways, which is far better than a price drop! This healthy price action on low volume tells me that sellers are happy holders and buyers are eager to buy. The inflation, deficit, and border crisis headline news is bad, but the chart trendlines show us a different picture. The major indexes and leading stocks are in bull market uptrends, so I choose to focus on that…
The NAAIM Member Exposure Index
The NAAIM Exposure Index represents the average exposure to US Equity markets as reported by our members in the organization’s weekly survey. Note that many NAAIM members are risk managers and tend to reduce exposure to the markets during high risk environments.
Click To See the Current Exposure Index
NOT INVESTMENT ADVICE. The analysis and information in this report and on our website is for informational purposes only. No part of the material presented in this report or on our websites is intended as an investment recommendation or investment advice. Neither the information nor any opinion expressed nor any Portfolio constitutes a solicitation to purchase or sell securities or any investment program. The opinions and forecasts expressed are those of the editors and may not actually come to pass. The opinions and viewpoints regarding the future of the markets should not be construed as recommendations of any specific security nor specific investment advice. Investors should always consult an investment professional before making any investment.
Tags: NAAIM, NAAIM Speaks, Stocks market analysis, Stock Market Analysis, Stock market, stock market indicators, David Moenning, Heritage Capital Research, Paul Schatz, Heritage Capital LLC, Rob Bernstein, RGB Capital Group, Ryan Redfern, Shadowridge Asset Management, Sam Bills, Bo Bills, Bills Asset Management, Dexter Lyons, Issachar Fund, Jim Lee, Stratfi, Craig Thompson, Asset Solutions, NAAIM Exposure Index, NAAIM Dynamic Allocation Model