NAAIM Speaks is monthly newsletter containing market insights and analysis from NAAIM member firms. “Speaks” is designed to provide a plethora of market analysis, indicators, some occasional humor, as well as a summary of NAAIM’s proprietary Dynamic Asset Allocation Model and Managers Exposure Index. The report is for informational uses only and is not to be construed as investment advice.
Changes Are Afoot in the New Year
By: David Moenning, Heritage Capital Research
Published: 1.19.21
Source: Ned Davis Research Group
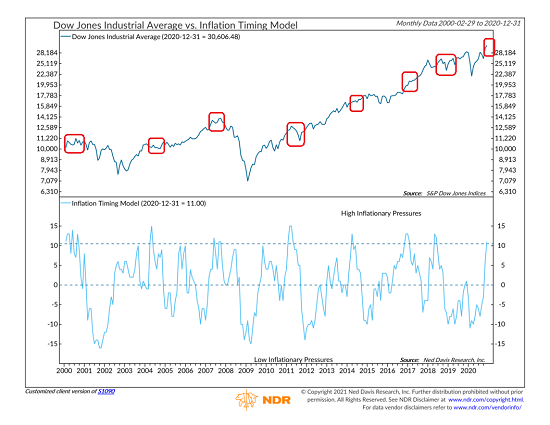
As we venture forth into the “brave new world” that is 2021, it is common for investors of all shapes and sizes to assume that the markets will continue to act in a manner similar to what they had been as the prior calendar year came to a close. However, in looking around at the landscape, I see changes taking place on many levels, not the least of which is the inflation picture…
How Stocks Fare on Inauguration Day and Beyond
By: Paul Schatz, Heritage Capital LLC
Published: 1.19.21

Wednesday is Inauguration Day (ID), a time of supposed new beginnings and a fresh start for the country. The truth of the matter is that stocks have been behaving as if there has been a new administration since the day after Election Day. That’s how the four-year Presidential Cycle works in the markets. The markets don’t wait until January 20th and then realize there is a new sheriff in town….
What Will Biden Proposals Mean for Investors?
By: Jeffrey Miller Dash of Insight
Published: 1.17.21

Despite intense partisan divisions, markets reflect continued optimism. There is certainly a new wall of worry facing newly elected political leaders. Everyone with an investment is wondering: What do Biden proposals mean for investors? And of course, will they become policy?…
The Message From the NAAIM Indicator Wall
By: National Association of Active Investment Managers
Updated: 11.6.20
The NAAIM Indicator Wall provides a weekly update to a robust array of stock market indicators. The “wall” includes readings and explanations of indicators and/or models in the areas of price/trend, momentum, key price levels, overbought/sold readings, sentiment, monetary, economic, inflation, and market cycles.
This time, we’re featuring the Fundamental Board , which is designed to identify the market’s fundamental backdrop.

Note: The Indicator Wall is a benefit provided to NAAIM Members and is password protected. To obtain a temporary password, contact NAAIM at 888-261-0787.
Quite a Ride
By: Ryan C. Redfern ShadowRidge Asset Management
Published: 12.31.20

Well, there you have it. Another trading year behind us that has been quite a ride. The S&P 5001 looks like it will end the year up around 17.5% (FastTrack data). That is incredibly surprising, given that the same index was down over -30% at one point back in March. It seemed a certainty that the economic shutdowns due to the Coronavirus were going to put the economy into recession. But somehow, we avoided that for now….
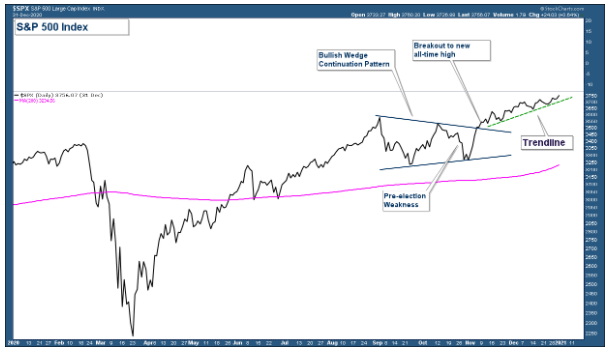
The Uptrend Remains Intact
By: Rob Bernstein, RGB Capital Group
Published: 1.19.21
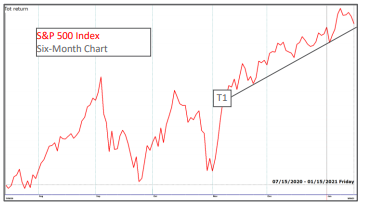
Stocks remain in an uptrend. The S&P 500 Index has pulled back over the last week, but remains above its uptrening trendline (T1). Uptrends are defined by stronger uplegs followed by weaker downlegs. As long as this pattern persists, the stock market will be in an uptrend….
The NAAIM Dynamic Allocation Model
Designed to be a value-add benefit to membership, NAAIM offers a Dynamic Asset Allocation Model based on the NAAIM Indicator Wall of indicators and models. The overall objective of the model portfolio is to dynamically adapt to changing market environments and to keep equity exposure in line with conditions. The model targets a normalized allocation of 60% stocks and 40% Bonds.
Here is this week’s model allocation:
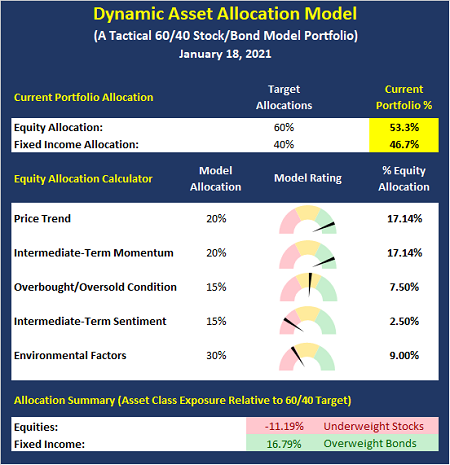
The model has been run live on the NAAIM website for several years and has demonstrated the ability to reduce exposure to market risk during negative environments such as those seen in 2015-16 and 2018.
More on the Dynamic Allocation Model and Historical Readings
The NAAIM Dynamic Allocation Model is for illustrative and informational purposes only, and does not in any way represent an endorsement by NAAIM or an investment recommendation.
Small is the New Big
By: Sam and Bo Bills Bills Asset Management
Published: 1.15.2
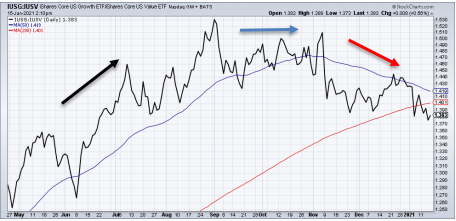
The character of the market has changed significantly over the last 2 months. While growth stocks dominated for much of 2020, value stocks have shown increasing relative strength since November. Value has excelled over the first 2 weeks of 2021. Market strength has also broadened measurably with small caps soaring over the last several weeks. The small cap Russell 2000 is up over 8% to start the year dwarfing the early 2021 returns of the S&P 500 and NASDAQ….
Time For A Pullback?
By: Craig Thompson, President Asset Solutions
Published: 12.7.20
Long-term the market continues to look bullish. However, market internals are suggesting that the odds of short-term weakness are increasing. Based upon strong longer-term technicals, any weakness is likely to be minor and shouldn’t change the longer-term bullish trend…
Staying Bullish For Now
By: Dexter P. Lyons Issachar Fund
Published: 1.12.21

Last week, I took some profits and reinvested those gains into new and existing growth stocks with favorable fundamentals and technical chart patterns. Being 99% invested speaks volumes about how bullish I currently am. I continue to find new opportunities to invest, but for now, I will continue to add stocks to my Buy list. I believe there was a ton of money on the sidelines ahead of the election uncertainty, but that has been resolved, and money is trying to find a new home away from the money market safety net. However….
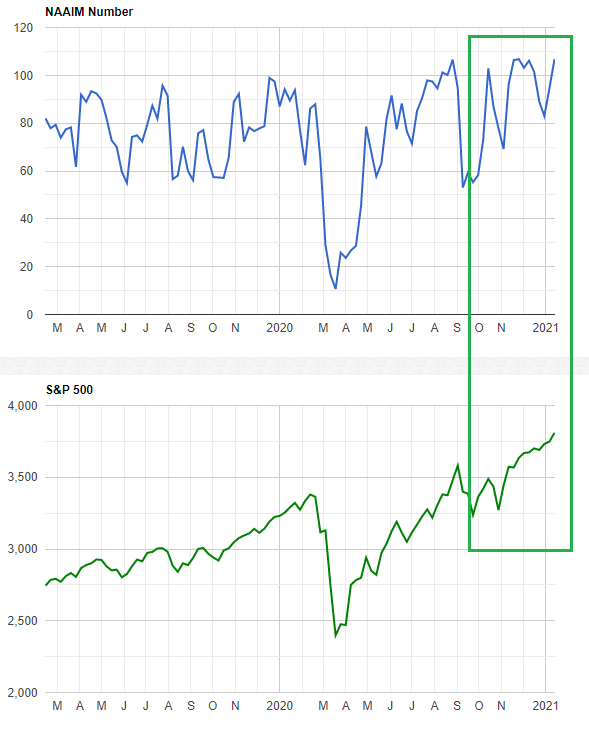
The NAAIM Member Exposure Index: Active Managers Still Onboard Bull Train
The NAAIM Exposure Index represents the average exposure to US Equity markets as reported by our members in the organization’s weekly survey. Note that many NAAIM members are risk managers and tend to reduce exposure to the markets during high risk environments.
More on the NAAIM Exposure Index
NOT INVESTMENT ADVICE. The analysis and information in this report and on our website is for informational purposes only. No part of the material presented in this report or on our websites is intended as an investment recommendation or investment advice. Neither the information nor any opinion expressed nor any Portfolio constitutes a solicitation to purchase or sell securities or any investment program. The opinions and forecasts expressed are those of the editors and may not actually come to pass. The opinions and viewpoints regarding the future of the markets should not be construed as recommendations of any specific security nor specific investment advice. Investors should always consult an investment professional before making any investment.
Tags: NAAIM, NAAIM Speaks, Stocks market analysis, Stock Market Analysis, Stock market, stock market indicators, David Moenning, Paul Schatz, Jeffrey Miller, Rob Bernstein, Ryan Redfern, Sam Bills, Bo Bills, Dexter Lyons, Craig Thompson, NAAIM Exposure Index, NAAIM Dynamic Allocation Model