NAAIM Speaks is monthly newsletter containing market insights and analysis from NAAIM member firms. This newsletter is designed to provide a plethora of market analysis, indicators, some occasional humor, as well as a summary of NAAIM’s proprietary Dynamic Asset Allocation Model and Managers Exposure Index. The report is for informational uses only and is not to be construed as investment advice.
Thunderstorms Brewing?
By: Paul Schatz, Heritage Capital LLC
Published: 7.31.23

I have been unequivocally bullish for 9 months. I don’t know many people who have been as positive as I have been, certainly no one who stuck their neck out while in the abyss to call for an end of the bear market and a new bull market. I know. I know. What have I done for you lately? While I am absolutely not calling for the end of the bull market or even a full-fledged correction of 10%+, I do think whatever weakness is coming by year-end is right in front of us. Summer brings thunderstorms, so…
Staying Seated on Bull Train
By: Ryan C. Redfern ShadowRidge Asset Management
Published: 3.31.23

Our Shadowridge Long-Term Trend indicator remains positive and supports the current run up we’re seeing in the major indexes. It could be stretched at this point, but at the moment, money flow supports the positive moves we’ve been seeing over the past couple of months. Our Mid-Term Cycle signal has been positive since the end of June. But unlike the spikes in money flows we saw in January and March; the June and July data has been much more subdued. But it has also been weakening over the past several days…
The Message From the NAAIM Indicator Wall
By: National Association of Active Investment Managers
The NAAIM Indicator Wall provides a weekly update to a robust array of stock market indicators. The “wall” includes readings and explanations of indicators and/or models in the areas of price/trend, momentum, key price levels, overbought/sold readings, sentiment, monetary, economic, inflation, and market cycles.
This time, we’re featuring the Primary Cycle Indicator Board , which is designed to identify the state of the the stock market’s “Primary Cycle”
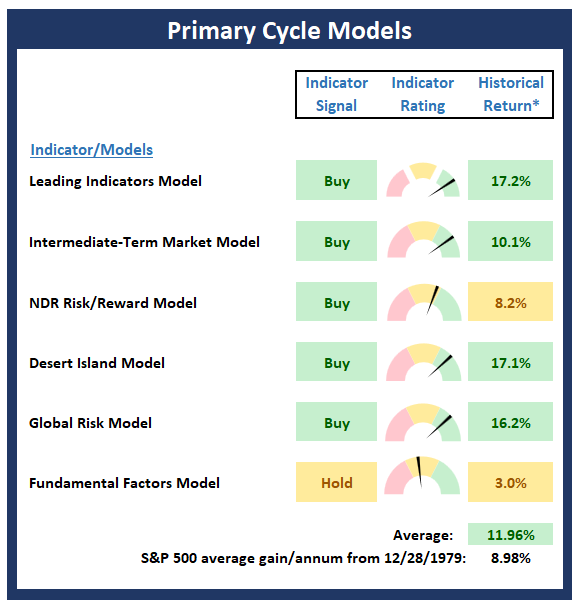
Note: The Indicator Wall is a benefit provided to NAAIM Members and is password protected. To obtain a temporary password, contact NAAIM at 888-261-0787.
Leaving The Door Open
By: Rob Bernstein, RGB Capital Group
Published: 7.31.23

As widely expected, the Fed raised short-term interest rates last week by 0.25% and left the door open for potentially more rate hikes in the future depending on incoming inflation data. The S&P 500 Index continued to trend up on the news and reached a new 52-week high on Friday…
Is Technology Getting Tired?
By: Craig Thompson, President Asset Solutions
Published: 7.24.23

One of the hallmarks of a bull market is sector rotation. I am sending out this update because we are starting to see the early signs of money moving out of technology, which has led this year’s market rally, and into lagging sectors/industry groups. Looking at a weekly chart of the Nasdaq 100 we find that last week’s candle is called a shooting star, a loss of momentum candle that suggests a possible change in trend…
The NAAIM Dynamic Allocation Model
Designed to be a value-add benefit to membership, NAAIM offers a Dynamic Asset Allocation Model based on the NAAIM Indicator Wall of indicators and models. The overall objective of the model portfolio is to dynamically adapt to changing market environments and to keep equity exposure in line with conditions. The model targets a normalized allocation of 60% stocks and 40% Bonds.
Here is this week’s model allocation:
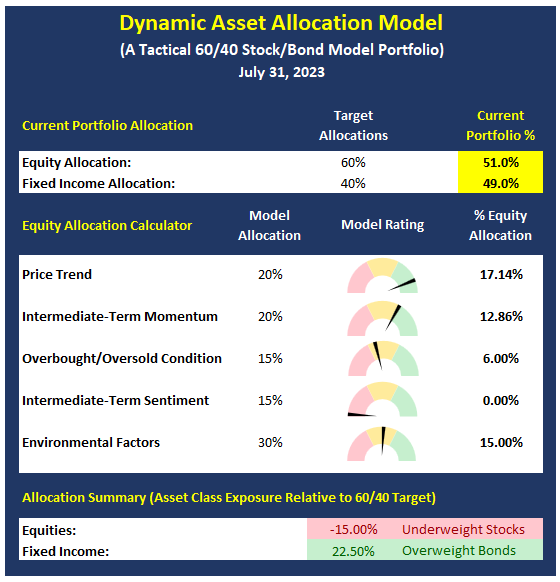
The model has been run live on the NAAIM website for several years and has demonstrated the ability to reduce exposure to market risk during negative environments such as those seen in 2015-16 and 2018.
More on the Dynamic Allocation Model and Historical Readings
The NAAIM Dynamic Allocation Model is for illustrative and informational purposes only, and does not in any way represent an endorsement by NAAIM or an investment recommendation.
If You Can’t Beat ‘Em, Join ‘Em!
By: Sam and Bo Bills Bills Asset Management
Published: 7.28.23

Many, if not most, investors missed the gains early in 2023. Those investors are now trying to play catch up to recapture their losses from 2022. Interestingly, despite the gains of 2023, all of the major indices remain well below early 2022 levels. The Dow, Nasdaq, S&P and Russell 2000 remain down -3%, -10%, -5% and -13%, respectively, from the beginning of last year. Said another way, buy and hold investors are down over the last 19 months despite the impressive returns this year. That is but one reason why we subscribe to an active management approach. Capturing gains is important, but avoiding losses is just as important if not more so. Those that missed the early 2023 gains are now jumping back in with both feet and are providing impetus for the market rise…
Resistance and Earnings Ahead
By: Dexter P. Lyons Issachar Fund
Published: 7.31.23

Before earnings were released, I sold a few stocks to avoid surprise price drops. I plan to buy more stocks with accelerating earnings and sales with raised analysts’ estimates from proper pivots. The market responded well to big named leading growth stock earnings releases and a 25bps Fed rate hike last week. The markets’ positive reaction to last week’s rate increase gives me more conviction that we are in a new bull market. We have some big stock earnings releases this week, but the market’s resilience will rotate out of the earnings misses and into the new leaders. The Artificial Intelligence (AI) themed stocks still appear to be under institutional accumulation, and that is where I believe most of the money will be made. I am finding great stock opportunities in the technology, medical, and energy sectors…
The NAAIM Member Exposure Index
The NAAIM Exposure Index represents the average exposure to US Equity markets as reported by our members in the organization’s weekly survey. Note that many NAAIM members are risk managers and tend to reduce exposure to the markets during high risk environments.
Click To See the Current Exposure Index
NOT INVESTMENT ADVICE. The analysis and information in this report and on our website is for informational purposes only. No part of the material presented in this report or on our websites is intended as an investment recommendation or investment advice. Neither the information nor any opinion expressed nor any Portfolio constitutes a solicitation to purchase or sell securities or any investment program. The opinions and forecasts expressed are those of the editors and may not actually come to pass. The opinions and viewpoints regarding the future of the markets should not be construed as recommendations of any specific security nor specific investment advice. Investors should always consult an investment professional before making any investment.
Tags: NAAIM, NAAIM Speaks, Stocks market analysis, Stock Market Analysis, Stock market, stock market indicators, David Moenning, Paul Schatz, Rob Bernstein, Ryan Redfern, Sam Bills, Bo Bills, Dexter Lyons, Craig Thompson, NAAIM Exposure Index, NAAIM Dynamic Allocation Model