


NAAIM Speaks is monthly newsletter containing market insights and analysis from NAAIM member firms. “Speaks” is designed to provide a plethora of market analysis, indicators, some occasional humor, as well as a summary of NAAIM’s proprietary Dynamic Asset Allocation Model and Managers Exposure Index. The report is for informational uses only and is not to be construed as investment advice.
Assuming Away The Can And…
By: David Moenning, Heritage Capital Research
Published: 5.6.20

There is an old joke which pokes fun at economists that I think applies to the current state of the stock market. It goes something like this…
An economist, a chemist, and a physicist are stranded on an island with nothing to eat but a can of beans. The chemist says, “Hey, there’s a small tide pool of salt water over there. If we set the can in it the salinity will cause the can to rust/disintegrate and we can eat the beans.” The physicist laughed and says, “You moron…
Bad News Is Good News For Stocks
By: Paul Schatz, Heritage Capital LLC
Published: 5.8.20

Stocks are up this week as Friday is about to kick off. Yesterday, we learned than another 3+ million Americans filed for first time unemployment benefits. Today, we learned that the unemployment rate for April skyrocketed to 14.7% with 20,000,000 jobs being “lost” in April. Those numbers are unfathomably unthinkable.
I didn’t do the homework, but I certainly believe that almost every horrific economic report has been met with a big rally by the bulls. I have written about this for decades and repeat it on TV all the time. It’s not what the news actually is, but rather how stocks react. In this environment, stocks are rallying on bad news. That is a positive no matter how much of a head scratcher it is….
Will Stocks Retest The March Lows?
By: Jeffrey Miller Dash of Insight
Published: 5.6.20

A reader saw a disturbing article and sent me a question about it. I suspect that many other readers of this article were also worried. It was a mainstream media article using data from a reputable source. Despite these credentials, the title, “Will the stock market tumble back to its coronavirus lows in March? About 92 years of S&P 500 history says there’s a good chance,” is not supported by the evidence and argument.
Investors must protect themselves by going past the headline. If the conclusion seems important, give the entire article a close reading before taking any action with your investments. I’ll use this article as an example. Let’s start with the heading for the story…
The Message From the NAAIM Indicator Wall: Fundamentals Still Holding
By: National Association of Active Investment Managers
Updated: 3.2.20
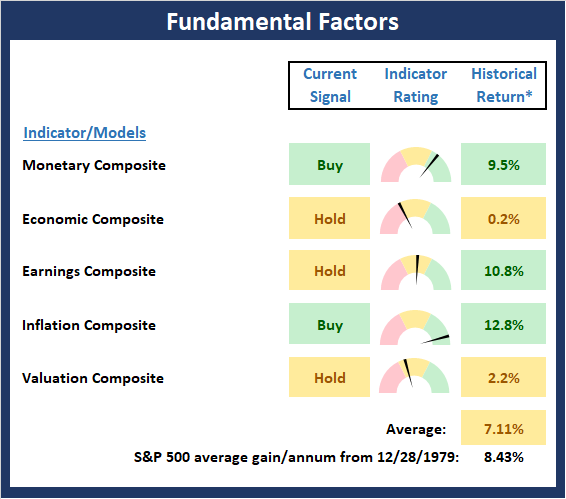
The NAAIM Indicator Wall provides a weekly update to a robust array of stock market indicators. The “wall” includes readings and explanations of indicators and/or models in the areas of price/trend, momentum, key price levels, overbought/sold readings, sentiment, monetary, economic, inflation, and market cycles.
This time, we’re featuring the Fundamentals Board, which reviews the market’s fundamental factors in the areas of interest rates, the economy, inflation, and valuations.
Note: The Indicator Wall is a benefit provided to NAAIM Members and is password protected. To obtain a temporary password, contact NAAIM at 888-261-0787.
Mining the NAAIM Indicator Wall for Real World Applications
Len Fox at Scarecrow Trading, who is a two-time winner of the NAAIM Shark Tank Active Investing Strategy Competition developed a couple of portfolio strategies based on the NAAIM Indicator Wall. Below is an update of the two portfolios Scarecrow runs:
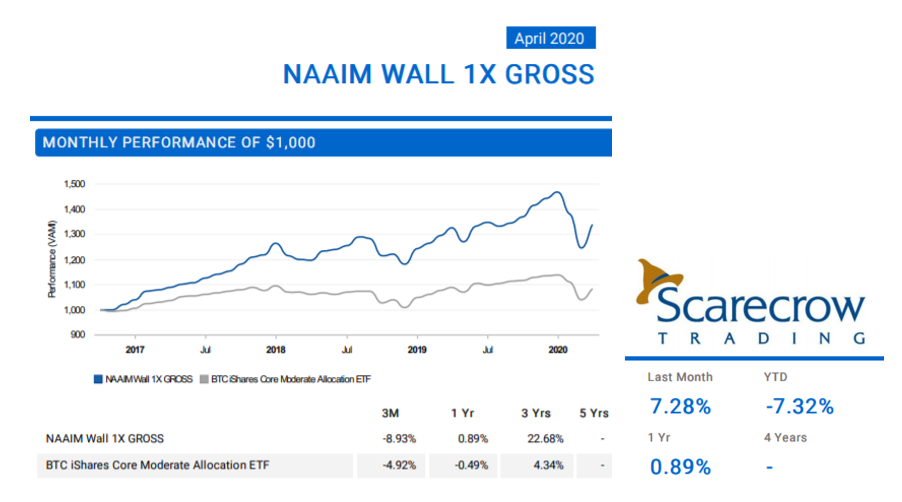
Feel free to contact Len or his team about the methodology used in these portfolios at (952) 250-7453.
Rule #1: Don’t Lose Big Money
By: Ryan C. Redfern ShadowRidge Asset Management
Published: 4.24.20

It sounds simple, but in practice, it can be quite a challenge. Still, as challenging as it may seem at times, it remains the foundation for how we manage money and risk in client accounts. That doesn’t mean our accounts won’t show negative returns in downturns/difficult periods. But it does mean that our focus is on limiting that downside as much as possible.
We mentioned last month how the markets were starting to take a break from the drastic sell-off we saw in late-February and early-March. Through April, there have been rebounds of varying success across the major market indices. One of the stronger rebounds has been in the NASDAQ (where we’ve focused our investing), while one of the weaker has been in Small Cap stocks…
Risk Remains High
By: Rob Bernstein, RGB Capital Group
Published: 5.4.20

This remains a high-risk environment with the future of the market directly tied to economic impact of shutting down the economy (which we are only beginning to understand), the ability for the economy to reopen, and the timing of a
therapy/vaccine to manage the virus…
The NAAIM Dynamic Allocation Model
Designed to be a value-add benefit to membership, NAAIM offers a Dynamic Asset Allocation Model based on the NAAIM Indicator Wall of indicators and models. The overall objective of the model portfolio is to dynamically adapt to changing market environments and to keep equity exposure in line with conditions. The model targets a normalized allocation of 60% stocks and 40% Bonds.
Here is this week’s model allocation:
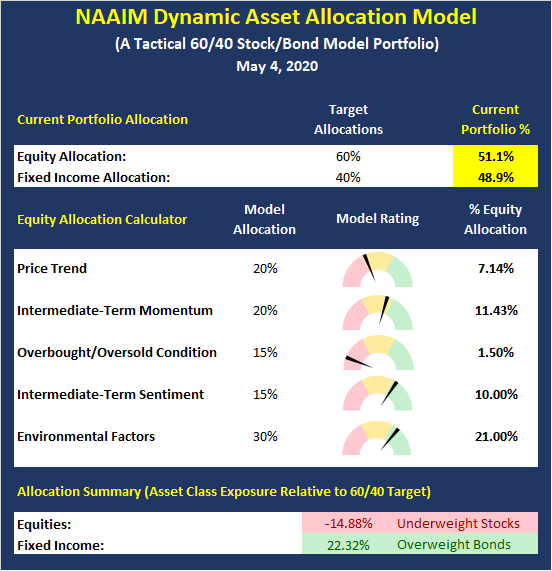
The model has been run live on the NAAIM website for several years and has demonstrated the ability to reduce exposure to market risk during negative environments such as those seen in 2015-16 and 2018.
More on the Dynamic Allocation Model and Historical Readings
The NAAIM Dynamic Allocation Model is for illustrative and informational purposes only, and does not in any way represent an endorsement by NAAIM or an investment recommendation.
Optimism vs. Reality
By: Sam and Bo Bills Bills Asset Management
Published: 5.1.20
Optimism on the virus front was tempered by the reality on the economic front. While CNBC and other financial pundits have cheered the end of the “bear market,” much uncertainty remains and a revisit to the March lows remains a distinct possibility. The S&P touched the upper end of the risk range on Wednesday before falling back to the lower end of the range today. After such a big move in April, it is not surprising to see some weakness here. The question is whether the markets are digesting gains or if they got ahead of themselves and are setting up a deeper decline. Our thought is…
The Technicals Are Telling Us…
By: Craig Thompson, President Asset Solutions
Published: 5.4.20
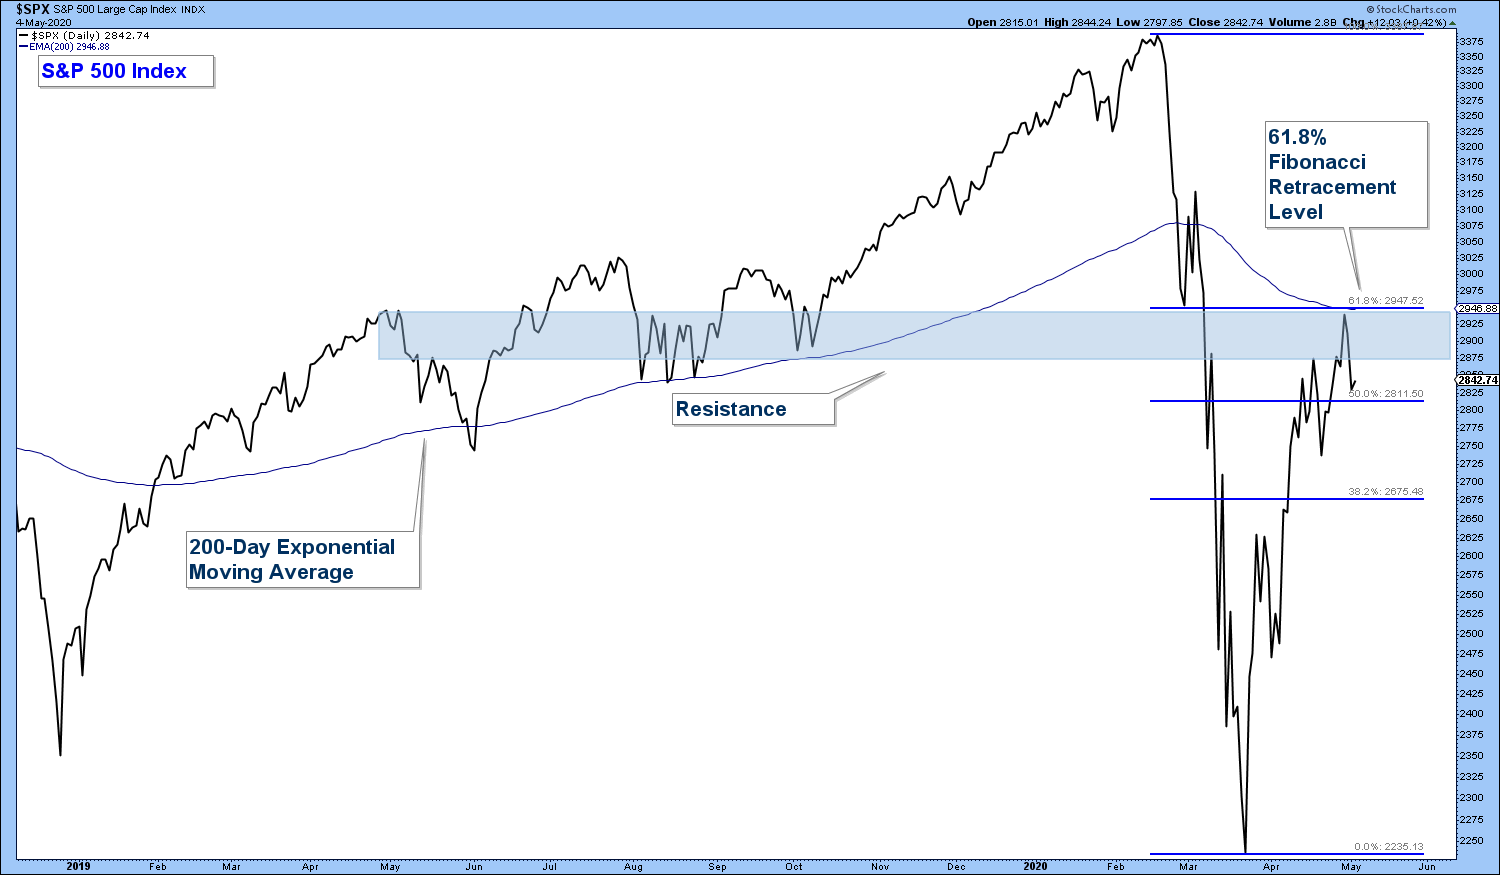
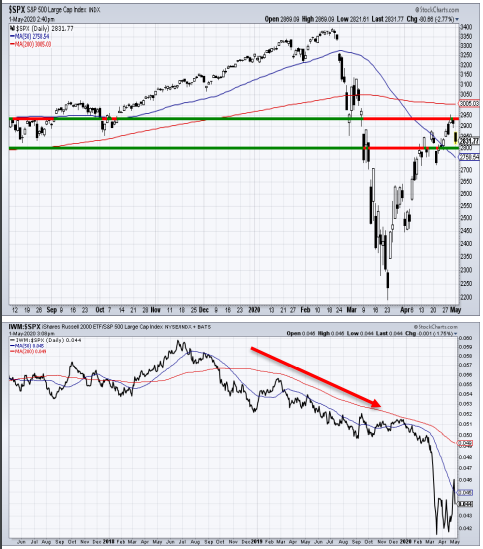
What the technicals are suggesting about the market: First, the S&P 500 has had a strong bounce after a 33% drop (chart below). The index now sits under it’s 200-day moving average, resistance and the 61.8% Fibonacci Retracement level. If the market is going to roll-over, this would be the area that I would expect that to occur.
Next, we have now exited what historically has been a seasonally strong period for the stock market. The fact that the stock market is down over the best months of the year is worrisome. We have now entered the worst seasonal period for stocks (May through October). As the saying goes: sell in May and go away…
Stick To The Cloud
By: Dexter P. Lyons Issachar Fund
Published: 5.4.20

The largest stock theme I see leans towards the “cloud” (internet) and “work from home” (teleconferencing) areas of the market. These stocks have been the recent leaders and that is why I like to “follow the money” when investing my fund’s assets. The “leaders” are stocks that appear to be under accumulation by institutions as measured by above average volumes. When large institutions decide to own a particular segment of the market like the “cloud” space, they will typically buy (accumulate) stocks over time. They normally attempt to “fly under the radar” to not make a “big wave” and bring attention to their purchases. I try to identify these “leaders” and stay in sync with the major trends seeking to ride the coat-tails of the “big boys”…
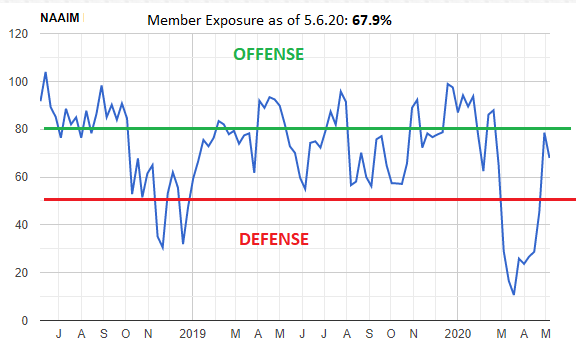
The NAAIM Member Exposure Index: Managers Cautiously Optimistic
The NAAIM Exposure Index represents the average exposure to US Equity markets as reported by our members in the organization’s weekly survey. Note that many NAAIM members are risk managers and tend to reduce exposure to the markets during high risk environments.
The last week’s exposure reading was 67.9, which remains a Moderately Positive reading.
More on the NAAIM Exposure Index
NOT INVESTMENT ADVICE. The analysis and information in this report and on our website is for informational purposes only. No part of the material presented in this report or on our websites is intended as an investment recommendation or investment advice. Neither the information nor any opinion expressed nor any Portfolio constitutes a solicitation to purchase or sell securities or any investment program. The opinions and forecasts expressed are those of the editors and may not actually come to pass. The opinions and viewpoints regarding the future of the markets should not be construed as recommendations of any specific security nor specific investment advice. Investors should always consult an investment professional before making any investment.
Tags: NAAIM, NAAIM Speaks, Stocks market analysis, Stock Market Analysis, Stock market, stock market indicators, David Moenning, Paul Schatz, Jeffrey Miller, Rob Bernstein, Ryan Redfern, Sam Bills, Bo Bills, Dexter Lyons, Craig Thompson, Len Fox, NAAIM Exposure Index, NAAIM Dynamic Allocation Model


