NAAIM Speaks is monthly newsletter containing market insights and analysis from NAAIM member firms. This newsletter is designed to provide a plethora of market analysis, indicators, some occasional humor, as well as a summary of NAAIM’s proprietary Dynamic Asset Allocation Model and Managers Exposure Index. The report is for informational uses only and is not to be construed as investment advice.
Indicators Screaming for Attention
By: David Moenning, Heritage Capital Research
Published: 4.3.24

After an impressive string of five consecutive monthly gains, during which the venerable S&P 500 gained an eye-popping 1,060.55 points (or +25.3%) during the November through March period, it now appears that the bears are finally (as in FINALLY!) attempting to get back in the game as indicators are screaming for attention…
Two-Day Decline – No One Cares
By: Paul Schatz, Heritage Capital LLC
Published: 4.3.24

As you know I have been looking for a Q1 peak followed by a less than 10% decline that wraps up by Memorial Day. We will see if that March peak holds and stock stop going up. Right now, because of the seasonal tailwinds this week, I think the bulls try and make a stand this morning. Don’t be surprised if they retrace the decline from yesterday before the week is done. Then the bears will need to step in again…
Calm Markets Tend To…
By: Ryan C. Redfern ShadowRidge Asset Management
Published: 3.29.24

A calm market tends to slowly grind up. And as we’ve observed before, the upward movement in this market is still concentrated in the S&P 500 and NASDAQ. Small Cap (Russell 2000) and Emerging Markets are both just barely positive on the year. We continue to be in a market where traditional “diversification” doesn’t do you any favors, as I’ve mentioned in past newsletters. The market seems to want to continue its grind up, so we are cautiously participating in as much as we find reasonable…
The Message From the NAAIM Indicator Wall
By: National Association of Active Investment Managers
The NAAIM Indicator Wall provides a weekly update to a robust array of stock market indicators. The “wall” includes readings and explanations of indicators and/or models in the areas of price/trend, momentum, key price levels, overbought/sold readings, sentiment, monetary, economic, inflation, and market cycles.
This time, we’re featuring the Early Warning Board , which is designed to suggest when the market may be ripe for a reversal on a short-term basis.

Note: The Indicator Wall is a benefit provided to NAAIM Members and is password protected. To obtain a temporary password, contact NAAIM at 888-261-0787.
Should We Be Worried?
By: Rob Bernstein, RGB Capital Group
Published: 4.1.24

The Nasdaq 100 Index led the stock market higher in 2023 and outperformed most of the major stock market indices. It looked like that leadership would continue as we entered 2024, however, the index has entered a short-term trading range. Is this a problem?
Let’s Review
By: Craig Thompson, President Asset Solutions
Published: 4.3.24

Stocks are in a bull market and are not overstretched from a long-term price perspective. In the short term, the stock market is overbought, momentum is waning, and volume indicators are falling. This is a warning (not a signal) that the market is ripe for a short-term pullback. Bond yields are no longer in a secular (20 – 40 year) bear market…
The NAAIM Dynamic Allocation Model
Designed to be a value-add benefit to membership, NAAIM offers a Dynamic Asset Allocation Model based on the NAAIM Indicator Wall of indicators and models. The overall objective of the model portfolio is to dynamically adapt to changing market environments and to keep equity exposure in line with conditions. The model targets a normalized allocation of 60% stocks and 40% Bonds.
Here is this week’s model allocation:
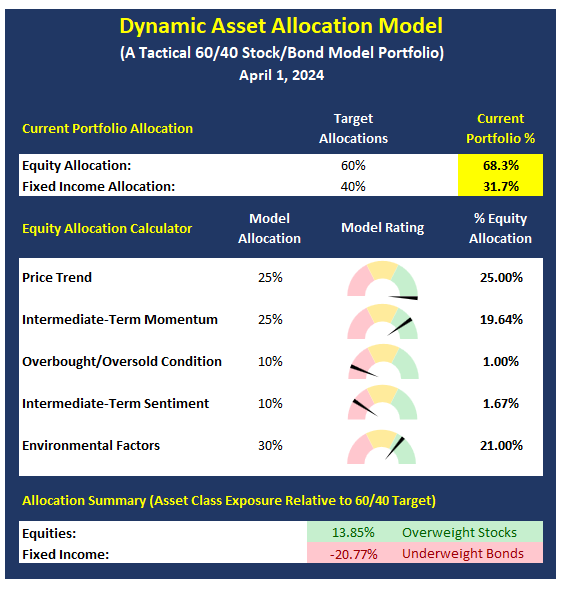
The model has been run live on the NAAIM website for several years and has demonstrated the ability to reduce exposure to market risk during negative environments such as those seen in 2015-16 and 2018.
More on the Dynamic Allocation Model and Historical Readings
The NAAIM Dynamic Allocation Model is for illustrative and informational purposes only, and does not in any way represent an endorsement by NAAIM or an investment recommendation.
Looking For a Buying Opportunity
By: Bo Bills Bills Asset Management
Published: 3.28.24

The major indices have meandered mostly sideways for the shortened trading week. Sideways consolidation can be constructive and help to form the base for the next leg up in a strong rally. While we did not make changes to our portfolios this week, we did evaluate some pockets of relative strength within the market. We will look to allocate to those areas should the market present a buying opportunity…
Another Stock Bubble?
By: Will Hepburn ShadowRidge Asset Management
Published: 3.29.24

Ray Dalio is a hedge fund manager that I really appreciate for his Zen-like ability to cut through the noise of the marketplace and make his decision making so clear. The following are excerpts from his recent paper on how he determines if we are in a stock market bubble or not…
The NAAIM Member Exposure Index
The NAAIM Exposure Index represents the average exposure to US Equity markets as reported by our members in the organization’s weekly survey. Note that many NAAIM members are risk managers and tend to reduce exposure to the markets during high risk environments.
Click To See the Current Exposure Index
NOT INVESTMENT ADVICE. The analysis and information in this report and on our website is for informational purposes only. No part of the material presented in this report or on our websites is intended as an investment recommendation or investment advice. Neither the information nor any opinion expressed nor any Portfolio constitutes a solicitation to purchase or sell securities or any investment program. The opinions and forecasts expressed are those of the editors and may not actually come to pass. The opinions and viewpoints regarding the future of the markets should not be construed as recommendations of any specific security nor specific investment advice. Investors should always consult an investment professional before making any investment.
Tags: NAAIM, NAAIM Speaks, Stock market analysis, Stock market, stock market indicators, David Moenning, Heritage Capital Research, Paul Schatz, Heritage Capital LLC, Rob Bernstein, RGB Capital Group, Ryan Redfern, Shadowridge Asset Management, Sam Bills, Bo Bills, Bills Asset Management, Dexter Lyons, Issachar Fund, Jim Lee, Stratfi, Craig Thompson, Asset Solutions, William Hepburn, NAAIM Exposure Index, NAAIM Dynamic Allocation Model