


NAAIM Speaks is monthly newsletter containing market insights and analysis from NAAIM member firms. “Speaks” is designed to provide a plethora of market analysis, indicators, some occasional humor, as well as a summary of NAAIM’s proprietary Dynamic Asset Allocation Model and Managers Exposure Index. The report is for informational uses only and is not to be construed as investment advice.
All Good News, But…
By: David Moenning, Heritage Capital Research
Published: 4.5.21

To aptly sum up the current state of the economy, I’ll borrow the words of CNBC’s Mike Santoli, who wrote on 4/5, “The economy is revving hard right now.” To be sure, the recent economic data have been stellar (Example: ISM Composite hit highest level on record). However, I wonder if some areas might be getting a little ahead of themselves…
Tech Back in Vogue
By: Paul Schatz, Heritage Capital LLC
Published: 4.7.21
Although April is only a week old we have seen a reversion back to mega cap technology like the FAAMNG stocks. Facebook, Google and Microsoft are at all-time highs. Apple remains in its funk, but poised for some gains in the short-term. I am starting to wonder aloud if it limps into earnings whether that will be a catalyst for a better rally out of earnings.
A New Pattern Has Developed
By: Ryan C. Redfern ShadowRidge Asset Management
Published: 3.26.21
I’m noticing a pattern in the market this year that has been challenging. The first half of the month has been generally positive, and then toward the end of the month, the market proceeds to sell-off. This is how January, February, and March have played out, and it’s made it somewhat difficult to latch on to any persistent, directional trends. But, as we have seen before, there can be extended periods of “meh” in the market. Often traders get lulled to sleep by the slow movement, then bam! A new trend can appear when you least expect it. And sometimes, much of the entire year’s gains can be made in these short periods of time. So, for now, we wait….
The Message From the NAAIM Indicator Wall
By: National Association of Active Investment Managers
Updated: 3.1.21
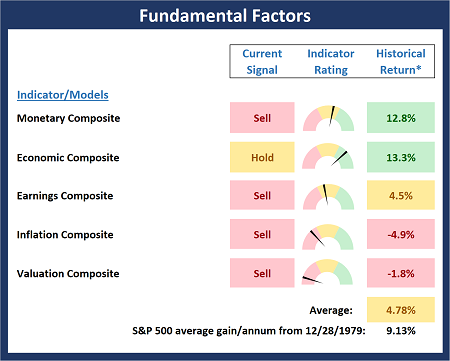
The NAAIM Indicator Wall provides a weekly update to a robust array of stock market indicators. The “wall” includes readings and explanations of indicators and/or models in the areas of price/trend, momentum, key price levels, overbought/sold readings, sentiment, monetary, economic, inflation, and market cycles.
This time, we’re featuring the Fundamental Board , which is designed to identify the state of the stock market’s fundamental inputs.
Note: The Indicator Wall is a benefit provided to NAAIM Members and is password protected. To obtain a temporary password, contact NAAIM at 888-261-0787.
Things Are Looking Up
By: Rob Bernstein, RGB Capital Group
Published: 4.5.21

The market environment has improved over the last two weeks with both large-cap stocks and junk bonds trending up. It is
unlikely that the stock market will continue to trend up without the participation of growth/technology stocks so I expect
that trend to turn up shortly if the rest of the market continues to move higher. With the financial system flush with
liquidity, the pace of vaccinations increasing, and the number of new jobs surging, the environment looks positive.
The NAAIM Dynamic Allocation Model
Designed to be a value-add benefit to membership, NAAIM offers a Dynamic Asset Allocation Model based on the NAAIM Indicator Wall of indicators and models. The overall objective of the model portfolio is to dynamically adapt to changing market environments and to keep equity exposure in line with conditions. The model targets a normalized allocation of 60% stocks and 40% Bonds.
Here is this week’s model allocation:
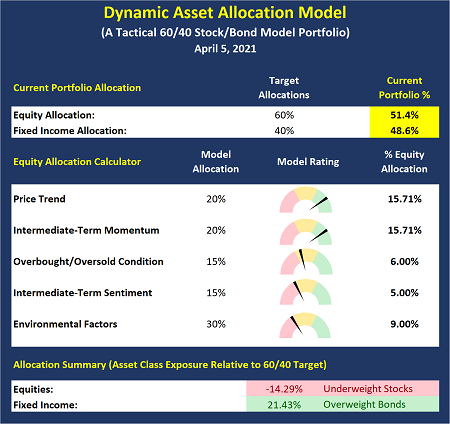
The model has been run live on the NAAIM website for several years and has demonstrated the ability to reduce exposure to market risk during negative environments such as those seen in 2015-16 and 2018.
More on the Dynamic Allocation Model and Historical Readings
The NAAIM Dynamic Allocation Model is for illustrative and informational purposes only, and does not in any way represent an endorsement by NAAIM or an investment recommendation.
A Tale of Two Tapes
By: Sam and Bo Bills Bills Asset Management
Published: 4.2.21

Large caps as represented by the S&P 500 inched up again this week logging another 1 in a relatively quiet week Yesterday’s move upward accounted for all the gains for the week and bodes well for a continuation of the rally into next week. But while the uptrend in large caps is quite defined, small caps have struggled a bit more The struggle was not entirely unexpected as the gains from November to early February was nothing short of extraordinary! However, small caps have gone nowhere since early February and closed yesterday at virtually the same levels as February 5th. That is not to say there hasn’t been some excitement
along the way…
No Roadblocks On The Horizon
By: Dexter P. Lyons Issachar Fund
Published: 4.5.21
![]()
I have been buying stocks that appear to be under accumulation and plan to continue as the market rewards us for taking risk. I believe the market has digested its recent gains and may be ready for higher highs. From my perspective, the market looks good and could continue to trend higher while new quarter money allocations get repositioned in the market. I do not see any fundamental roadblocks on the horizon, so we could see another run at new highs for the major indexes…
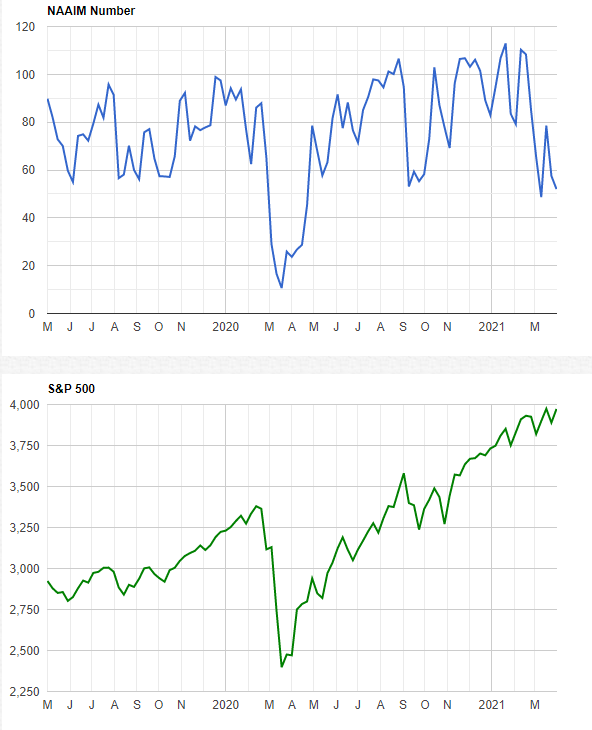
The NAAIM Member Exposure Index: Active Managers Turning Cautious
The NAAIM Exposure Index represents the average exposure to US Equity markets as reported by our members in the organization’s weekly survey. Note that many NAAIM members are risk managers and tend to reduce exposure to the markets during high risk environments.
NOT INVESTMENT ADVICE. The analysis and information in this report and on our website is for informational purposes only. No part of the material presented in this report or on our websites is intended as an investment recommendation or investment advice. Neither the information nor any opinion expressed nor any Portfolio constitutes a solicitation to purchase or sell securities or any investment program. The opinions and forecasts expressed are those of the editors and may not actually come to pass. The opinions and viewpoints regarding the future of the markets should not be construed as recommendations of any specific security nor specific investment advice. Investors should always consult an investment professional before making any investment.
Tags: NAAIM, NAAIM Speaks, Stocks market analysis, Stock Market Analysis, Stock market, stock market indicators, David Moenning, Paul Schatz, Jeffrey Miller, Rob Bernstein, Ryan Redfern, Sam Bills, Bo Bills, Dexter Lyons, Craig Thompson, NAAIM Exposure Index, NAAIM Dynamic Allocation Model


