


NAAIM Speaks is monthly newsletter containing market insights and analysis from NAAIM member firms. This newsletter is designed to provide a plethora of market analysis, indicators, some occasional humor, as well as a summary of NAAIM’s proprietary Dynamic Asset Allocation Model and Managers Exposure Index. The report is for informational uses only and is not to be construed as investment advice.
A Powerful Indicator Just Lit Up
By: Paul Schatz, Heritage Capital LLC
Published: 4.10.23

Those of you of used to watch Wall Street Week with Louis Rukeyser may remember the late, great Marty Zweig. He was one of the greats in technical analysis of the stock market and his research is legendary. Last week, a very powerful Zweig indicator called Zweig Breadth Thrust triggered for only the 12th time since 1960…
A Trend Worth Noting?
By: Ryan C. Redfern ShadowRidge Asset Management
Published: 3.31.23

What I’m finding intriguing is that the market has been changing direction, or at very least its tone, around the 15th of the month. It has done that several times over the past year. I’m not sure if it is something significant or just something to be aware of. It is certainly an interesting data point to note…
The Message From the NAAIM Indicator Wall
By: National Association of Active Investment Managers
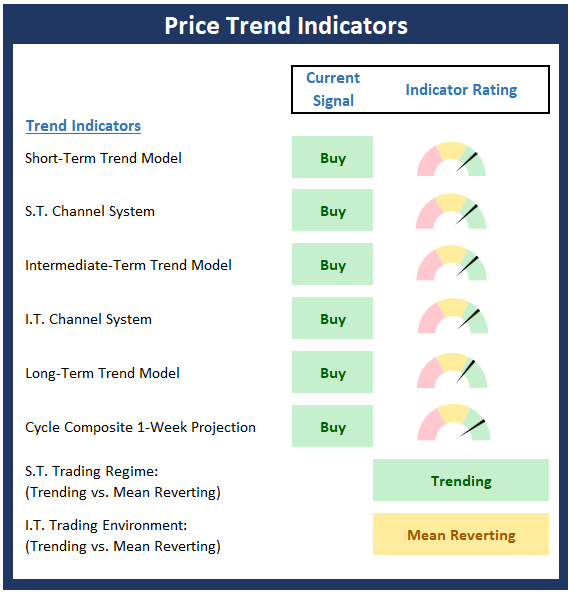
The NAAIM Indicator Wall provides a weekly update to a robust array of stock market indicators. The “wall” includes readings and explanations of indicators and/or models in the areas of price/trend, momentum, key price levels, overbought/sold readings, sentiment, monetary, economic, inflation, and market cycles.
This time, we’re featuring the Trend Indicator Board , which is designed to identify the primary trend of the overall “state of the stock market.”
Note: The Indicator Wall is a benefit provided to NAAIM Members and is password protected. To obtain a temporary password, contact NAAIM at 888-261-0787.
The Next Worry
By: Rob Bernstein, RGB Capital Group
Published: 4.10.23

Much of the stock market has stabilized following the banking issues that surfaced last month. While the stock market
environment has improved, we are starting to see more indications that the economy is slowing as a result of the aggressive
rate hikes implemented by the Federal Reserve over the last year. If the economy slows down enough…
Weak Link
By: Craig Thompson, President Asset Solutions
Published: 4.3.23

As long as the S&P 500 continues to trade above its 200-day moving average market conditions are favorable from a price perspective. However, given that the majority of market internals have turned decidedly negative I don’t place a lot of confidence in the market’s ability to continue to trade above…
The NAAIM Dynamic Allocation Model
Designed to be a value-add benefit to membership, NAAIM offers a Dynamic Asset Allocation Model based on the NAAIM Indicator Wall of indicators and models. The overall objective of the model portfolio is to dynamically adapt to changing market environments and to keep equity exposure in line with conditions. The model targets a normalized allocation of 60% stocks and 40% Bonds.
Here is this week’s model allocation:

The model has been run live on the NAAIM website for several years and has demonstrated the ability to reduce exposure to market risk during negative environments such as those seen in 2015-16 and 2018.
More on the Dynamic Allocation Model and Historical Readings
The NAAIM Dynamic Allocation Model is for illustrative and informational purposes only, and does not in any way represent an endorsement by NAAIM or an investment recommendation.
The Few Lead The Many
By: Sam and Bo Bills Bills Asset Management
Published: 4.7.23

We remain cautious and do believe that any short-term rise in the market will likely be met with selling in the coming weeks. However, there may be a tradeable rally to make money in the interim. The first quarter of 2023 was a good one on paper. However, a look beneath the surface tells another story…
Crosscurrents
By: Dexter P. Lyons Issachar Fund
Published: 3.6.23

The rescue liquidity the Fed created to save the banks is beginning to dry up, and many stocks are starting to show results of rolling over. We were positioned for a continuation of a growth stock up-trend created by another round of Fed balance sheet expansion (QE). However, the market seems to be in “risk off” mode as the Fed unwinds its balance sheet (QT) like it was doing before the Fed’s liquidity injection to prevent more “bank runs.” There is still a lot of “free money” sloshing around supporting the big liquid names with the heaviest weightings in the major indexes. However, many recent leading stocks have come under heavy selling pressure, indicating the stock market may again…
The NAAIM Member Exposure Index
The NAAIM Exposure Index represents the average exposure to US Equity markets as reported by our members in the organization’s weekly survey. Note that many NAAIM members are risk managers and tend to reduce exposure to the markets during high risk environments.
Click To See the Current Exposure Index
NOT INVESTMENT ADVICE. The analysis and information in this report and on our website is for informational purposes only. No part of the material presented in this report or on our websites is intended as an investment recommendation or investment advice. Neither the information nor any opinion expressed nor any Portfolio constitutes a solicitation to purchase or sell securities or any investment program. The opinions and forecasts expressed are those of the editors and may not actually come to pass. The opinions and viewpoints regarding the future of the markets should not be construed as recommendations of any specific security nor specific investment advice. Investors should always consult an investment professional before making any investment.
Tags: NAAIM, NAAIM Speaks, Stocks market analysis, Stock Market Analysis, Stock market, stock market indicators, David Moenning, Paul Schatz, Rob Bernstein, Ryan Redfern, Sam Bills, Bo Bills, Dexter Lyons, Craig Thompson, NAAIM Exposure Index, NAAIM Dynamic Allocation Model


