


NAAIM Speaks is monthly newsletter containing market insights and analysis from NAAIM member firms. “Speaks” is designed to provide a plethora of market analysis, indicators, some occasional humor, as well as a summary of NAAIM’s proprietary Dynamic Asset Allocation Model and Managers Exposure Index. The report is for informational uses only and is not to be construed as investment advice.
An Interest(ing) Development
By: David Moenning, Heritage Capital Research
Published: 3.1.21

Normally, when prices on a chart move up quickly, it’s a good thing. However, when the move occurs in bond yields, it’s the opposite and many analysts call such a move a “tantrum” – as in the market pitching a hissy fit. In this case the temper tantrum in rates is being attributed to the combination of more aid/stimulus (which in turn, will create massive increases in the supply of bonds the government will have to sell), economic data that has largely surprised to the upside, and of course, the long-awaited uptick – albeit modest – on the inflation front.
Buying Weakness Remains The Play
By: Paul Schatz, Heritage Capital LLC
Published: 3.1.21
![]()
Markets continue to be volatile as I have been writing. I expect that theme to continue this week. The culprit has been the dramatic rise in long-term bond yields. The 10-year note has risen from 0.50% to 1.60% since August. Markets can adjust to most things, however, they tend to stumble when changes happen in spike fashion. This big question is whether this is just another modest pullback in an ongoing bull market or something more serious. The majority of the evidence points to the former.
Building A Transition Portfolio
By: Jeffrey Miller Dash of Insight
Published: 2.28.21

Readers often ask how I can remain so cautious about committing new money to long-term equity investments. While I have been providing updates about how I have been positioned, some have asked for more detail. As an investment manager, I obviously cannot just list my holdings. Instead, I will do the following…
The Message From the NAAIM Indicator Wall
By: National Association of Active Investment Managers
Updated: 3.1.21
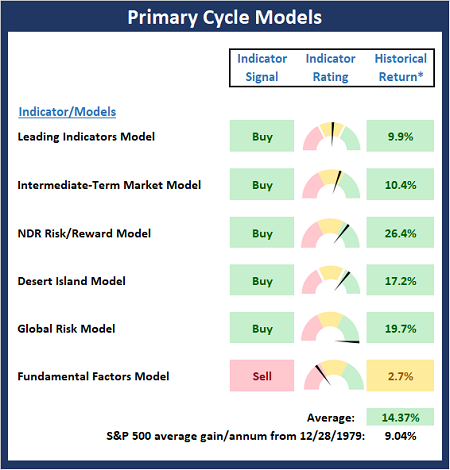
The NAAIM Indicator Wall provides a weekly update to a robust array of stock market indicators. The “wall” includes readings and explanations of indicators and/or models in the areas of price/trend, momentum, key price levels, overbought/sold readings, sentiment, monetary, economic, inflation, and market cycles.
This time, we’re featuring the Primary Cycle Board , which is designed to identify the state of the primary trend.
Note: The Indicator Wall is a benefit provided to NAAIM Members and is password protected. To obtain a temporary password, contact NAAIM at 888-261-0787.
Are Stocks Going Down the Inflation Rabbit Hole?
By: Ryan C. Redfern ShadowRidge Asset Management
Published: 2.26.21

Inflation is its own rabbit hole, which you can go down here. It’s interesting stuff, but there are other metrics and data we find more effective in making investment decisions. If you’ve followed me for a while, you know that I prefer to “follow the money” above all else. Institutions and individuals alike vote with their dollars and that, I believe, is what actually moves the price of assets…
A Temporary Headwind?
By: Rob Bernstein, RGB Capital Group
Published: 3.1.21

The recent rise in rates and decline in stocks has caught my attention. Interest rates remain at historically low levels and the
Federal Reserve has made it clear that they do not anticipate raising short-term interest rates any time soon. These factors,
along with increased vaccine distribution, additional government stimulus and a reduction in the economic restrictions put
in place by states to control the spread of the virus are all positive for the stock market. As such, I believe this is a
temporary headwind for the stock and bond markets.
The NAAIM Dynamic Allocation Model
Designed to be a value-add benefit to membership, NAAIM offers a Dynamic Asset Allocation Model based on the NAAIM Indicator Wall of indicators and models. The overall objective of the model portfolio is to dynamically adapt to changing market environments and to keep equity exposure in line with conditions. The model targets a normalized allocation of 60% stocks and 40% Bonds.
Here is this week’s model allocation:
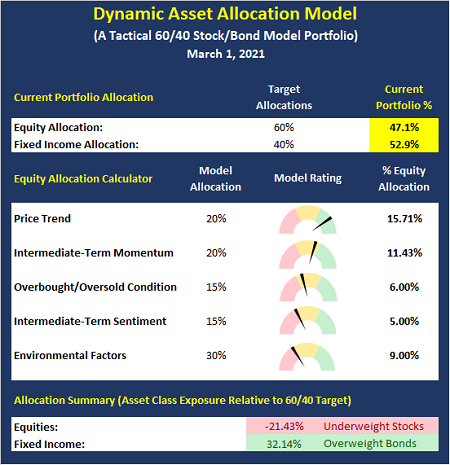
The model has been run live on the NAAIM website for several years and has demonstrated the ability to reduce exposure to market risk during negative environments such as those seen in 2015-16 and 2018.
More on the Dynamic Allocation Model and Historical Readings
The NAAIM Dynamic Allocation Model is for illustrative and informational purposes only, and does not in any way represent an endorsement by NAAIM or an investment recommendation.
Pullbacks are Just Part of the Game
By: Sam and Bo Bills Bills Asset Management
Published: 2.26.21

While sharp one or two-day declines can be scary, there is really nothing out of the ordinary with the current weakness. As
we have discussed in these pages over the last couple of weeks, the markets were over-extended and overdue for a pullback
of some kind. Investors have, to their detriment, become accustomed to a slow trudge upward so the increased volatility has
spooked some of those investors. However, in the context of the last few months, the decline is extremely modest and has
done nothing to the longer trend of the markets…
The Song Remains The Same
By: Craig Thompson, President Asset Solutions
Published: 3.2.21

In our last two newsletters, I highlighted how I felt the weight of the technical evidence was suggesting that market risk was elevated; however, the trend of major market indexes was up. A month has past and this is still the case…
Following The Discipline
By: Dexter P. Lyons Issachar Fund
Published: 3.1.21

US Treasury 20yr bond yields have been rising since January, and the stock market seemed to be okay as it continued higher. However, last Monday through Thursday, yields spiked over 13% and spooked investors as stocks dropped. No one knows if this is a 10% correction or a pullback of something less or the start of a bear market, so I followed my discipline…
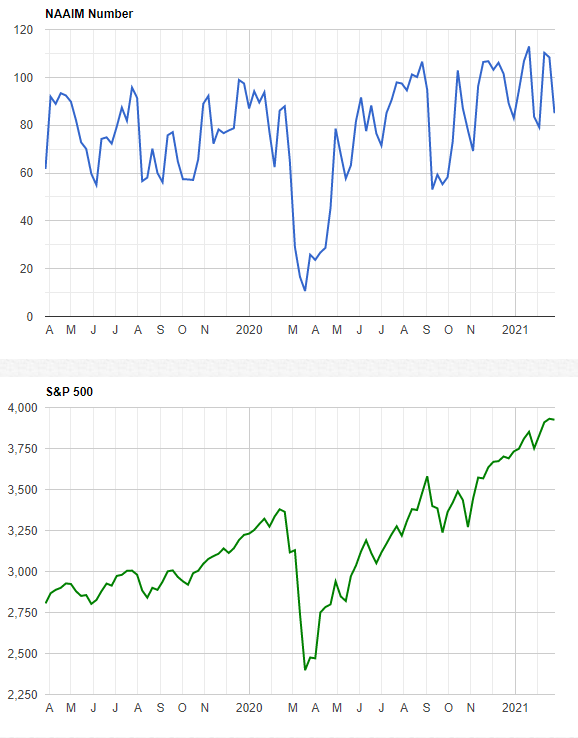
The NAAIM Member Exposure Index: Managers Remain Cautiously Optimistic
The NAAIM Exposure Index represents the average exposure to US Equity markets as reported by our members in the organization’s weekly survey. Note that many NAAIM members are risk managers and tend to reduce exposure to the markets during high risk environments.
More on the NAAIM Exposure Index
NOT INVESTMENT ADVICE. The analysis and information in this report and on our website is for informational purposes only. No part of the material presented in this report or on our websites is intended as an investment recommendation or investment advice. Neither the information nor any opinion expressed nor any Portfolio constitutes a solicitation to purchase or sell securities or any investment program. The opinions and forecasts expressed are those of the editors and may not actually come to pass. The opinions and viewpoints regarding the future of the markets should not be construed as recommendations of any specific security nor specific investment advice. Investors should always consult an investment professional before making any investment.
Tags: NAAIM, NAAIM Speaks, Stocks market analysis, Stock Market Analysis, Stock market, stock market indicators, David Moenning, Paul Schatz, Jeffrey Miller, Rob Bernstein, Ryan Redfern, Sam Bills, Bo Bills, Dexter Lyons, Craig Thompson, NAAIM Exposure Index, NAAIM Dynamic Allocation Model


