


The NAAIM Indicator Wall – Focus On The Fundamentals
By: National Association of Active Investment Managers
Updated: 11.26.18
The NAAIM Indicator Wall provides a weekly update to a robust array of stock market indicators. The “wall” includes readings and explanations of indicators and/or models in the areas of price/trend, momentum, key price levels, overbought/sold readings, sentiment, monetary, economic, inflation, and market cycles.
This week, we’re featuring the “External Factor” Indicator Board, which is a group of indicators designed to help us stay in line with the state of the big-picture market drivers including monetary conditions, the economy, inflation, and valuations.
Note: The Indicator Wall is a benefit provided to NAAIM Members and is password protected. To obtain a temporary password, contact NAAIM at 888-261-0787.
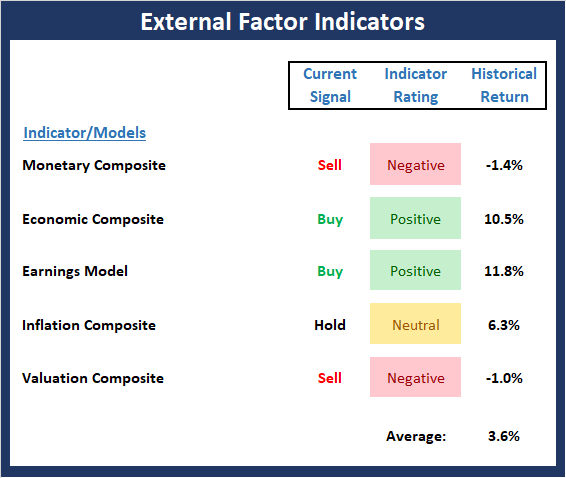
2018: A Tough Row to Hoe
By: David Moenning, Heritage Capital Research
Published: 11.26.18
For most investors, 2018 is turning out to be a tough row to hoe. Suddenly, nobody is talking about global synchronized growth, low inflation, the benefits of tax cuts, and 20% earnings growth. No, all that is now so 2017. Now investors are focused on slowing global growth, rising rates, an overzealous Fed, a global trade war, plunging oil prices, a rising dollar, risk in the corporate credit markets, and de-FAANGing their portfolios.
However, all this negativity is a rather recent development. Recall that until the beginning of October, the 2018 investing game had been pretty simple. Buy U.S. stocks and focus on those popular momentum-oriented names. Easy peasy, right?
But as is often the case, just about the time everybody had figured out the game, everything changed.
So here we are; staring at just 25 trading days left in the year. The bottom line on this fine Monday morning is that most investors are focusing on the negative and fearing the worst. Gone is the hope that ongoing earnings growth will produce strong stock market returns for as far as the eye could see. In its place is the idea of “correcting” prices for the new normal. A “normal” that includes the word “slowing” in front of just about every bullet point in the market narrative.
A Lot Of Red Out There
In looking at the year-to-date returns of the various asset classes through Friday, the appropriate theme song for the year would be, Nowhere to Run. Take a look at the numbers below and you’ll see what I mean.

Man, that’s a lot of red.
LYONS MARKET UPDATE – Sitting In Cash
By: Dexter P. Lyons Issachar Fund
Published: 11.26.18
Bottom line: I believe risk is high and not deserving of my hard-earned-money. However, the more I think I know, the more close-minded I become so I try to remain humble and have a teachable spirit. In order to be successful in the market, you need to think independently and admit when you are wrong. Otherwise, you run the risk of learning things the hard way!
RGB Perspectives – If These Support Levels Hold…
By: Rob Bernstein, RGB Capital Group
Published: 11.26.18
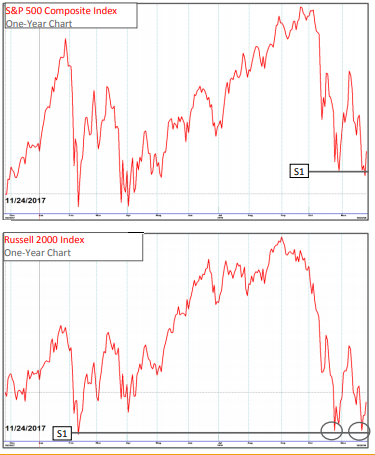
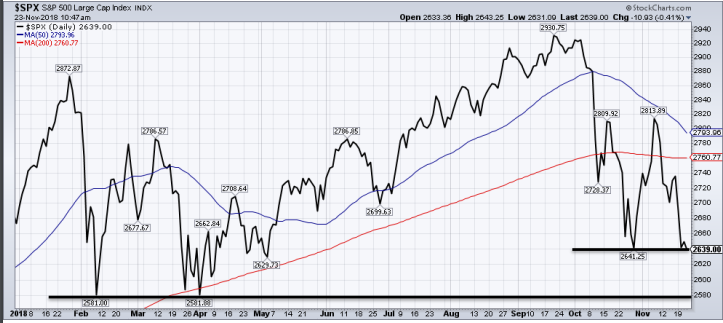
When the market experiences a sharp decline, it is not
unusual for the market to rally and then test the previous
lows. That is exactly what has happened with the S&P 500
Composite Index. After declining through the month of
October it rallied and then dropped back to the late October
lows (S1) last week. The S&P 500 is -8.8% below its all-time
high.
The Russell 2000 Index has a very similar chart pattern…
What Happened to the “Easy” Week?
By: Paul Schatz, Heritage Capital LLC
Published: 11.23.18
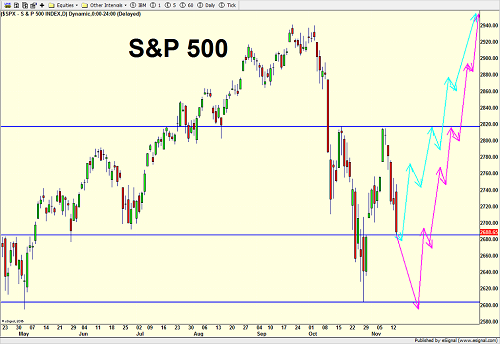
This week was supposed to see a mild drift higher, especially after Monday. You know, it was one of those “easy” weeks where you sit back, do nothing and watch your portfolio rise. Stocks “always” rise during Thanksgiving week. It’s those strong seasonal tailwinds. Well, someone forgot to inform the bears who have been out in force selling the entire week with the exception of Wednesday morning. I know I didn’t expect to see this kind of damage this week. I thought the bears would stay at bay and allow a little holiday rally before the possible resumption and completion of the correction next week or the week after. I hate being caught off guard.
Today is one of those half days for the stock market. We sometimes get them around July 4th and Christmas. The industry wants to be closed but the powers that be on the exchanges don’t want to lose coveted business to Europe. Hence the half day. It’s also a day where liquidity is very light, making it much easier to push stocks around. The day after Thanksgiving is also typically one of those “easy” days where stocks “always” rise. That doesn’t appear to be the case today, at least at the open, as the market looks to open down roughly 3/4%. With so many investors taking the day off, I wouldn’t be shocked if the bears exhaust themselves early in the day and the bulls can move stocks from there.
What comes next, you ask? Let’s look at the chart projection…
BAM Market Note – Risk is High
By: Sam and Bo Bills Bills Asset Management
Published: 11.23.18
The relief rally earlier this month seems like a long time ago as the markets have now returned to the lows visited in October. We currently sit right on those lows and the bulls will need to make a stand here or risk another downdraft back down to the February and April lows. Thanksgiving week is often a quiet week with a slow upward bias. Not this year! Monday and Tuesday of this week saw losses of 3.5% in the S&P before a feeble bounce on Wednesday. Weakness has returned this morning. It is imperative for the market to hold at current levels or we are very likely headed back down the lows of earlier this year (some 2% lower). If those lows fail to hold, then a compelling argument could be made that a new bear market has begun and much deeper losses would be coming. The normal holiday tailwinds have yet to materialize but Santa may yet come to lessen the blow. Risk is very high and any bounces should be viewed with skepticism. We are happily sitting this out and watching from the sidelines. If a sustainable rally begins we will redeploy the portfolios but we remain very cautious.
Weekly Update: The NAAIM Member Exposure Index
The NAAIM Exposure Index represents the average exposure to US Equity markets reported by our members.
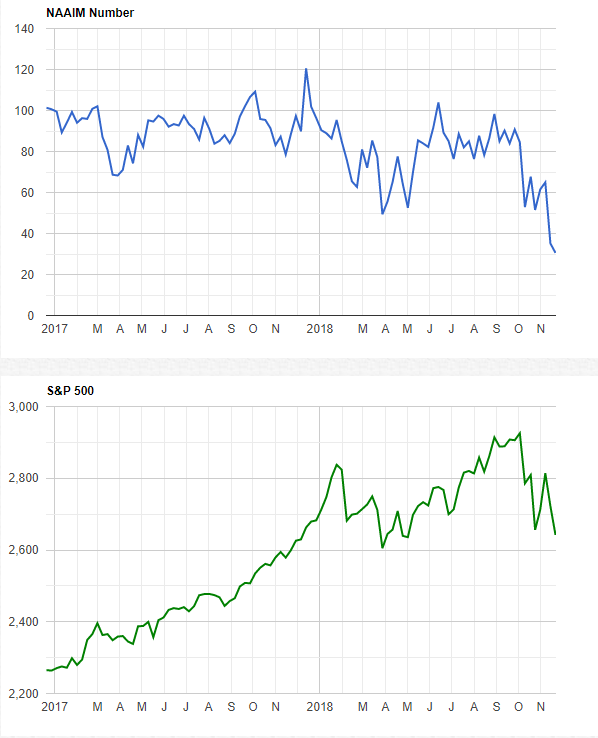
More on the NAAIM Exposure Index
Weekly Update: The Emotomy Exposure Index
Published by: Emotomy.com
The Emotomy Exposure Index represents the average daily exposure to equity markets in the investment accounts of Emotomy’s clients. This Index provides insight into the actual adjustments investment advisers have made to client accounts over time.
Current Emotomy Exposure Index Reading: 74.6
Current Direction: Up


